T Stock Drops 10.82% on Friday, RSI Oversold
On October 9, 2026: price 22.18 USD, trend downtrend, RSI 26.3, support 22.18, resistance 26.72. technical analysis of t stock. Stock Drops — full details here.
Why T is in focus today
- One-day move of -10.82%, about 3.9× its average daily range (ATR)
- Volume at 3.5× the 20-day average
- Closed at a 20-day low (22.18)
- Fresh death cross: SMA20 crossed below SMA50
- RSI(14) at 26.3 — oversold zone
- Downtrend extending (5-day change -8.72%)
Selected automatically from 30 NYSE (US) stocks by a technical-signal score with daily weighted randomisation — not a recommendation.
Trend & Price Action
The decline extends beyond a single session: AT&T lost 8.72% over five days and 14.89% over one month. Its price is below both the SMA20 and SMA50, each at $24.96, and the SMA20’s slope is falling. The newly formed death cross—when the shorter-term average moves below the longer-term one—reinforces the bearish trend rather than indicating a settled reversal. The stock sits at the bottom of its 20-day range, with $22.18 support and $26.72 resistance. That position matters: a close at the range low shows sellers controlled the session, but it also puts the immediate support level under pressure. Over the three-month period, AT&T’s high was $26.93 and its low was $20.62, putting the current price above the wider-period low but well below the high. The price structure remains bearish: the death cross, falling average, and close at the 20-day low all point in the same direction.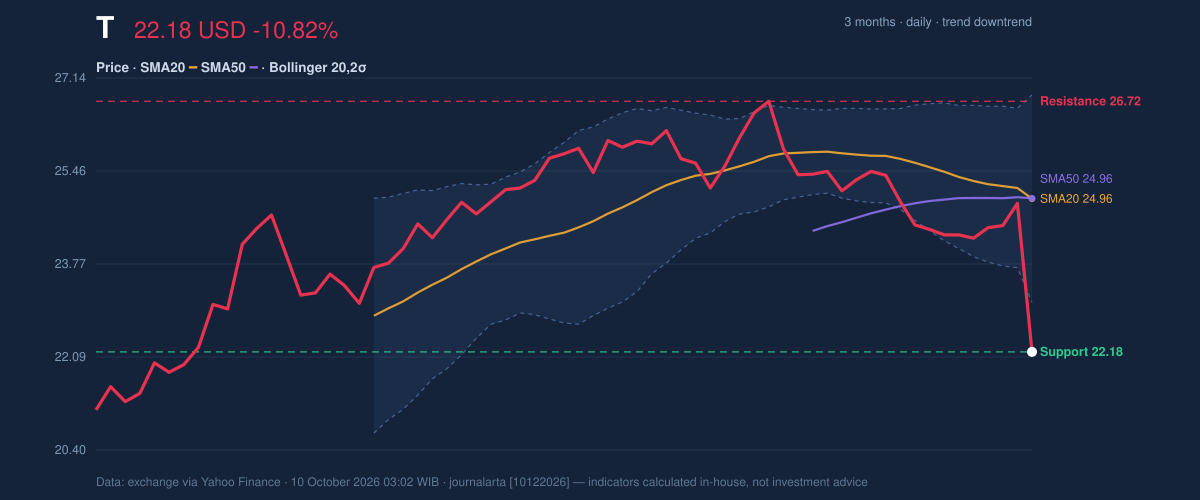
Oscillators & Momentum
Momentum indicators agree with the downtrend, though they also show that the decline has become stretched. The RSI(14) at 26.3 is oversold; RSI measures the pace of recent gains and losses, and readings below 30 are commonly treated as oversold. The Stochastic readings—%K at 5.7 and %D at 27.3—are also oversold, indicating that recent closes have been near the lower end of their trading range. Oversold does not mean the price must rebound. Here, MACD remains negative at -0.387, below its -0.161 signal line, with a negative histogram of -0.226. That combination indicates downward momentum is still in force. A recovery would be more credible if the indicators began to turn upward alongside a price move back above support; the current readings alone do not confirm one.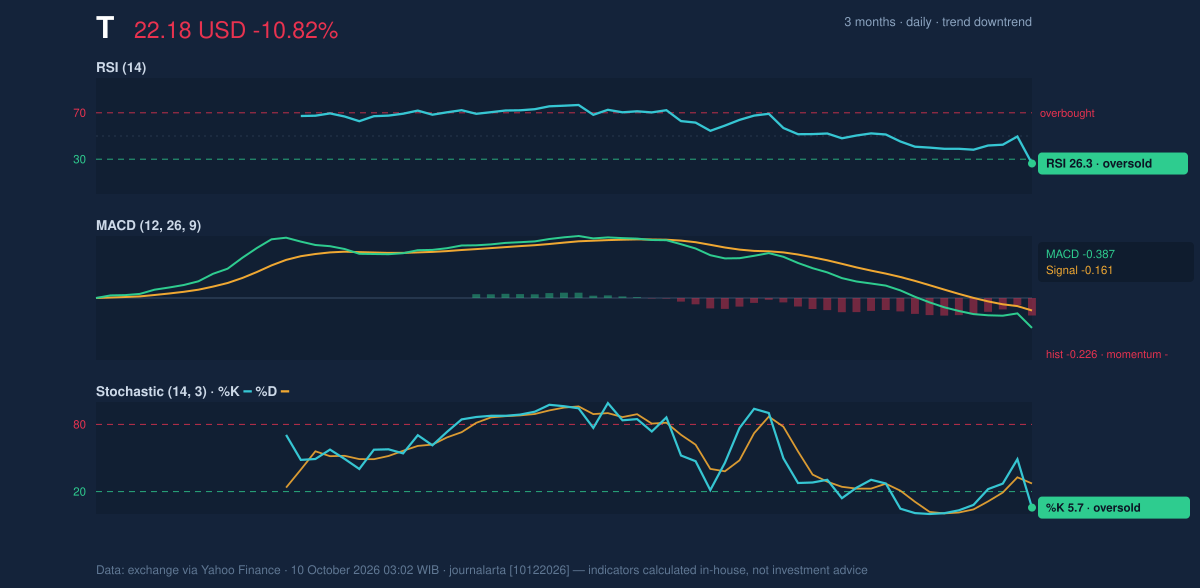
Volatility, Volume & Key Levels
AT&T’s last price is below the lower Bollinger Band at $23.08, with %B at -24%. Bollinger Bands compare price with a moving average and its recent variability; trading below the lower band suggests an unusually weak close relative to that recent range. The band width is 15.1%, described as normal, so the move is not accompanied by an exceptionally wide volatility band. ATR is $0.62, or 2.8% of the share price, indicating moderate measured volatility—though the latest one-day fall was unusually large relative to that average. The volume spike confirms heavy participation in the sell-off, while falling OBV (on-balance volume, a measure that tracks buying and selling pressure through volume) offers no sign of accumulation. Together, those measures make the decline harder to dismiss as a low-volume wobble. The immediate test is $22.18 support. Holding it could allow an oversold bounce, with $23.08—the lower Bollinger Band—and the moving averages near $24.96 serving as reference levels on a recovery. A break below $22.18 would put the three-month low of $20.62 in focus. On the upside, $26.72 resistance is the key 20-day ceiling; reclaiming it would be needed to challenge the bearish structure.Technical Verdict: HOLD (wait & see)
HOLD (wait & see) fits the conflicting signals: the death cross and negative MACD favor caution, while oversold RSI and Stochastic readings leave room for a rebound without confirming one. The volume surge and falling OBV further weaken the case for treating the drop as a completed reversal. - Ideal entry range: $22.18–$23.08, contingent on support holding and price stabilizing near the lower Bollinger Band. - Exit target: $24.96–$26.72, spanning the SMA20/SMA50 level to 20-day resistance. - Stop-loss protection: below $20.62, the three-month low. - Invalidation: this verdict is invalidated if price breaks below $22.18, the immediate 20-day support. In plain English, the chart says AT&T is under strong selling pressure, but its oversold readings make it reasonable to wait for evidence that the decline is stabilizing. | Indicator | Reading | |---|---:| | Last price | $22.18 | | 1-day change | -10.82% | | 5-day / 1-month change | -8.72% / -14.89% | | SMA20 / SMA50 | $24.96 / $24.96 | | MA cross | Death cross | | RSI(14) | 26.3, oversold | | Stochastic %K / %D | 5.7 / 27.3, oversold | | MACD / signal / histogram | -0.387 / -0.161 / -0.226 | | Bollinger lower / middle / upper | $23.08 / $24.96 / $26.84 | | Volume / 20-day average | 150,406,100 / 43,517,665 | | 20-day support / resistance | $22.18 / $26.72 | | Three-month high / low | $26.93 / $20.62 |Summary Data T
| Last price | 22.18 USD |
| Change 1 day / 5 days / 1 month | -10.82% / -8.72% / -14.89% |
| Trend / MA-cross | downtrend / death |
| SMA20 / SMA50 | 24.96 / 24.96 |
| RSI (14) / Stochastic %K | 26.3 / 5.7 |
| Bollinger %B / ATR | -24% / 0.62 |
| Support / Resistance 20 days | 22.18 / 26.72 |
| Data as of | 10 October 2026 03:02 WIB |
Disclaimer: This technical analysis is generated automatically from exchange data (via Yahoo Finance) and indicators calculated by JournalArta, for information and education only. The verdict and the entry, target and stop-loss levels are not investment advice or a solicitation to buy or sell any security. Investment decisions and their risks rest solely with the reader.
Track T stock price daily: live levels, support/resistance and our full T analysis history.