VZ Stock Drops 10.14%, RSI Oversold In Focus
On October 9, 2026: price 41.65 USD, trend downtrend, RSI 22.1, support 41.65, resistance 51.45. technical analysis of vz stock. VZ Stock Drops — full details…
Why VZ is in focus today
- One-day move of -10.14%, about 3.7× its average daily range (ATR)
- Volume at 3.7× the 20-day average
- Closed at a 20-day low (41.65)
- RSI(14) at 22.1 — oversold zone
- Downtrend extending (5-day change -9.30%)
Selected automatically from 30 NYSE (US) stocks by a technical-signal score with daily weighted randomisation — not a recommendation.
Trend & Price Action
Verizon’s last price of $41.65 sits below its 20-day simple moving average (SMA) of $47.00 and its 50-day SMA of $48.13. The 20-day average is also falling, down 2.62% over five days. Together, those readings indicate a persistent downtrend, not a short-lived dip within an otherwise rising structure. There has been no new moving-average crossover to signal a change in trend. The shares closed at the 20-day support level of $41.65, at the bottom of the recorded range. The three-month low is $40.81, while the three-month high is $51.67. The proximity to the three-month low matters: the price has limited room to fall before testing that broader trough, but a nearby low is not evidence that support will hold. As shown in the chart, price remains beneath both moving averages and below the lower Bollinger Band at $42.82. The band’s middle line is $47.00 and its upper line is $51.18. Verizon’s Bollinger %B reading of -14% means the price has moved below the lower band, a sign of an unusually sharp decline rather than a confirmed reversal.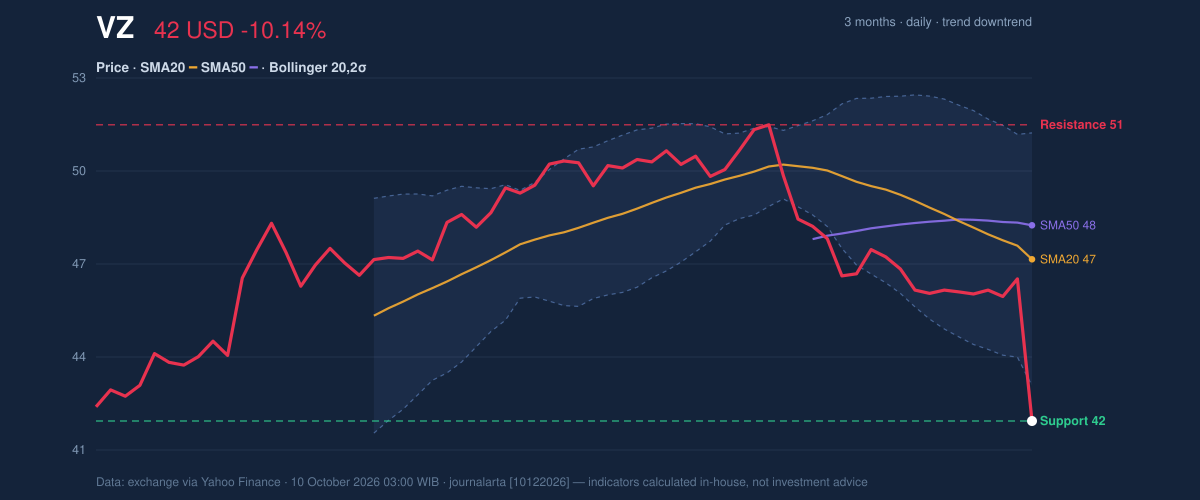
Oscillators & Momentum
The RSI, or Relative Strength Index, is 22.1, while the Stochastic readings are 12.0 for %K and 20.8 for %D. Both measures are in oversold territory, meaning the recent decline has been steep relative to the indicators’ look-back periods. Oversold conditions can accompany a rebound, but they can also persist while a downtrend continues. The MACD, a measure comparing shorter- and longer-term price momentum, is negative at -1.109, below its signal line at -0.735; its histogram is -0.374. This confirms that downward momentum remains in place. The momentum picture is therefore mixed in a specific way: RSI and Stochastic warn that selling has become stretched, while MACD does not yet show that the downward force has turned.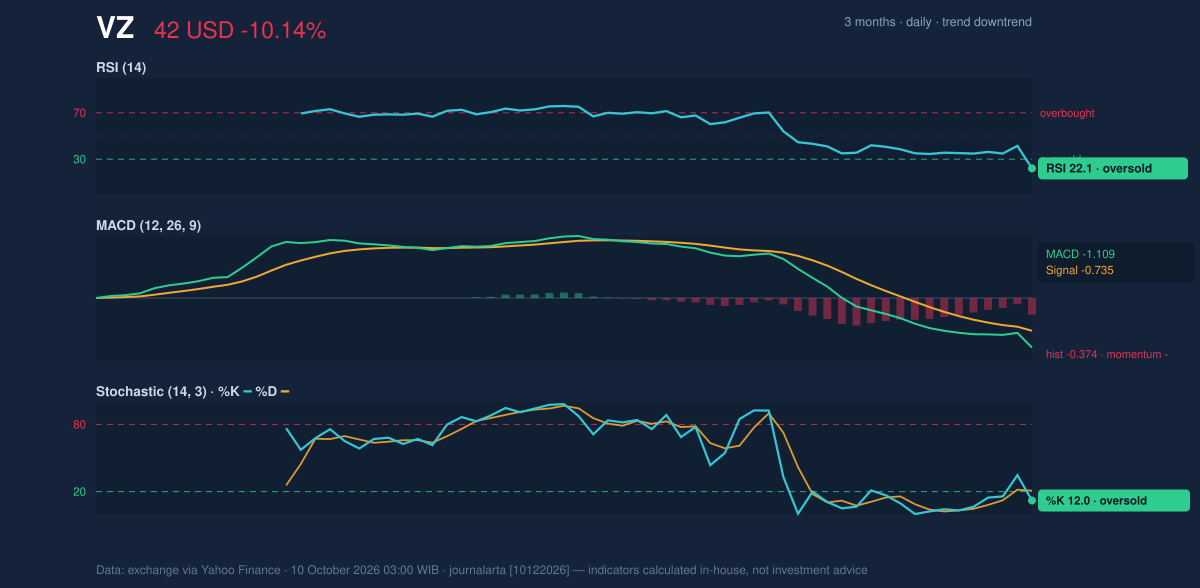
Volatility & Volume
The latest session’s volume was 95,070,900 shares, compared with a 20-day average of 25,967,355. That 3.7-times volume surge gives the price drop added significance: the sell-off drew much more participation than a routine down day. On-balance volume (OBV), which tracks whether volume is associated with buying or selling pressure, is falling as well, reinforcing the weakness rather than contradicting it. The daily move was about 3.7 times the average trading range, based on the reported average true range (ATR) of $1.14, or 2.7% of the share price. ATR measures typical price movement, not direction; here, the exceptional decline signals heightened short-term risk. Bollinger Band width is 17.8%, described as normal, so the data do not show a volatility squeeze that would point to a quiet period before a breakout.Key Levels & Scenarios
The immediate test is whether Verizon can hold $41.65, the reported 20-day support and the closing low for the period. Below that, the three-month low at $40.81 is the next reference in the supplied data. A failure to hold the three-month low would invalidate the technical verdict below; a hold at current support, by contrast, would be only an initial sign of stabilization, not a reversal by itself. On any recovery, the lower Bollinger Band at $42.82 is the first nearby reference, followed by the 20-day SMA at $47.00. The reported 20-day resistance is $51.45, close to the three-month high of $51.67. Those levels frame the gap between a tentative bounce and a more substantial recovery: the price would need to reclaim moving-average territory to weaken the current downtrend.Technical Verdict: HOLD (wait & see)
The indicators favor caution rather than a directional call. The downtrend remains dominant: price is below falling short-term averages, MACD is negative, and falling OBV confirms heavy selling participation. Oversold RSI and Stochastic readings raise the possibility of a bounce, but do not yet establish one. - Ideal entry range: $41.65–$42.82, anchored to the reported 20-day support and lower Bollinger Band; the data do not confirm that support will hold. - Exit target: $47.00–$51.45, spanning the 20-day SMA and reported 20-day resistance. - Stop-loss protection: $40.81, at the three-month low. - Invalidation: The HOLD verdict is invalidated if price falls below $40.81. For non-traders, HOLD means the chart shows both unusually stretched selling and an intact downtrend, so the evidence has not yet settled on a clear direction.Summary Data VZ
| Last price | 41.65 USD |
| Change 1 day / 5 days / 1 month | -10.14% / -9.30% / -17.70% |
| Trend / MA-cross | downtrend / none |
| SMA20 / SMA50 | 47.00 / 48.13 |
| RSI (14) / Stochastic %K | 22.1 / 12.0 |
| Bollinger %B / ATR | -14% / 1.14 |
| Support / Resistance 20 days | 41.65 / 51.45 |
| Data as of | 10 October 2026 03:00 WIB |
Disclaimer: This technical analysis is generated automatically from exchange data (via Yahoo Finance) and indicators calculated by JournalArta, for information and education only. The verdict and the entry, target and stop-loss levels are not investment advice or a solicitation to buy or sell any security. Investment decisions and their risks rest solely with the reader.
Track VZ stock price daily: live levels, support/resistance and our full VZ analysis history.