On October 9, 2026: price 71.51 USD, trend sideways, RSI 52.6, support 67.88, resistance 72.63. technical analysis of uber stock. UBER Stock Gains — full…
By Elena Vance
October 12, 20264 min read
UBER Stock Gains 1.81% on Friday, Momentum Gains
Uber Technologies rose 1.81% to $71.51 on October 10, extending its five-day gain to 4.99% and bringing the stock within reach of a key resistance level. The shares are worth watching after JournalArta had not covered them in the previous 14 days; technically, the move is testing whether improving momentum can overcome a broader sideways trend.
Trend & Price Action
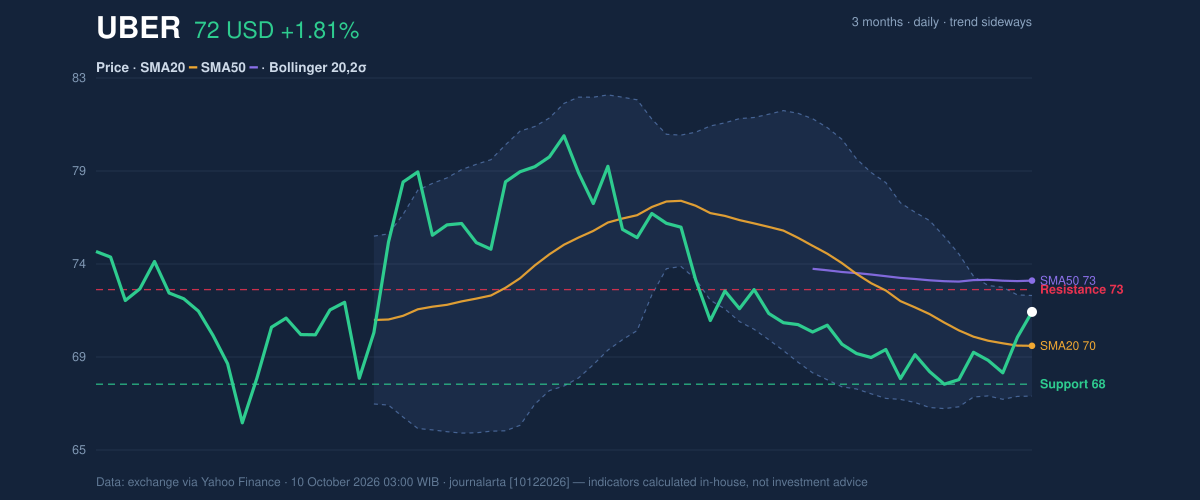
Uber is trading above its 20-day simple moving average, or SMA—a measure of the average closing price over that period—but remains below its 50-day average. The $69.81 SMA20 is therefore near-term support, while the $73.08 SMA50 marks a higher hurdle. There has been no fresh crossover between the averages, so the recent rise has yet to establish a clear change in the medium-term trend.
The 20-day SMA’s slope is down 1.09% over five days, even as the price has gained. That divergence suggests a short-term rebound against a still-soft trend, rather than confirmation that the broader direction has turned upward. The stock sits 76% of the way through its 20-day trading range, closer to resistance at $72.63 than to support at $67.88.
3-month price action chart of UBER: price, SMA20/50, Bollinger, support & resistance. Data: exchange via Yahoo Finance.
The chart shows price relative to the moving averages, Bollinger Bands and key support and resistance. Uber is approaching the upper Bollinger Band at $72.34, with the band’s midpoint at $69.81 and lower edge at $67.28. The upper band’s proximity helps explain why further gains may meet near-term resistance; a sustained move above the resistance area would be a more meaningful test of whether buyers can extend the rebound. Over the past three months, the shares have ranged from $65.41 to $82.36, leaving the current price below the period high.
Oscillators & Momentum
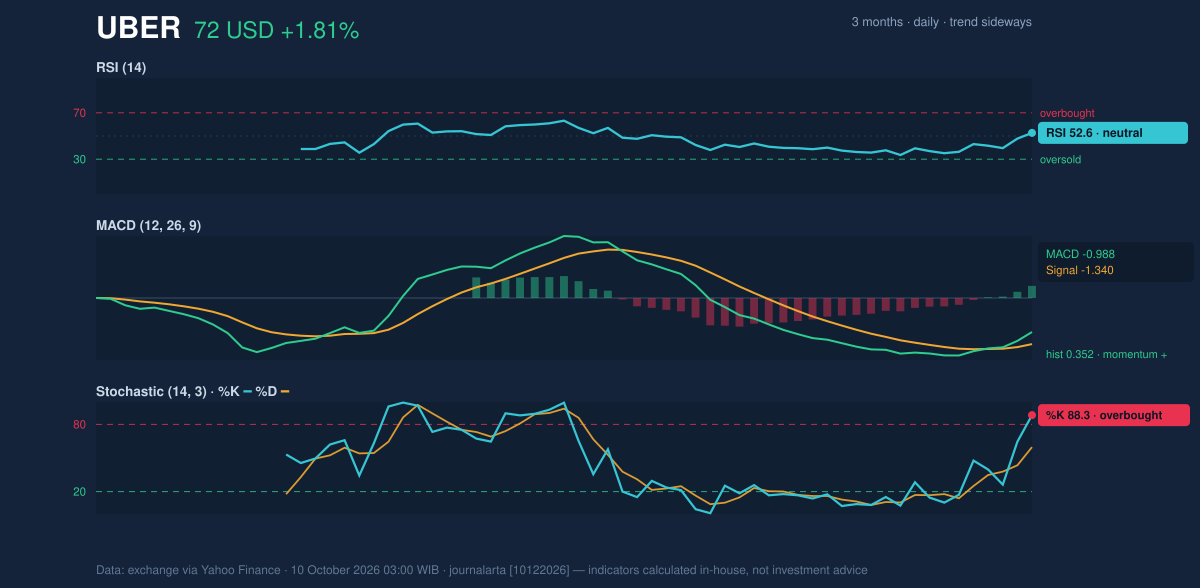
Momentum readings are mixed. The RSI is 52.6, a neutral reading; the Relative Strength Index gauges the pace of recent price changes, and this reading points to neither unusually strong buying nor heavy selling. By contrast, the Stochastic is overbought, with %K at 88.3 and %D at 59.7. That indicator compares a closing price with its recent range, so the elevated %K signals that the advance has brought the stock close to the top of its short-term trading band.
The MACD momentum is positive: its histogram is 0.352, while the MACD line at -0.988 is above its signal line at -1.340. MACD compares two moving averages to track momentum; the positive histogram indicates improving near-term pressure, although both lines remain below zero. The combination points to a rebound gaining traction, but not yet to a decisive trend reversal.
Momentum chart of UBER: RSI(14), MACD, Stochastic. Data: exchange via Yahoo Finance.
Volatility & Volume
The Bollinger Band width is 7.2% and narrowing, a squeeze that reflects a period of lower price dispersion and can precede a larger move in either direction. It does not, by itself, identify which way the shares will break. With price at 84% of the distance between the lower and upper bands, the stock is nearer the upper edge than the lower one.
Average True Range, or ATR, is $1.58, equal to 2.2% of the price, indicating moderate daily volatility. Volume was 16.54 million shares, close to the 20-day average of 16.77 million, while On-Balance Volume is rising. That volume pattern is consistent with buying participation, but turnover was essentially normal rather than an unusually strong confirmation of the latest gain.
Key Levels & Scenarios
A sustained break above $72.63 resistance would put the 50-day average at $73.08 in focus and test whether the rebound can develop beyond a short-term move. Failure to clear resistance, especially alongside the overbought Stochastic reading, would leave room for a retreat toward the $69.81 SMA20. A decline through $67.88 support would weaken the near-term setup; the lower Bollinger Band at $67.28 is the next reference from the supplied data.
Technical Verdict: HOLD
The indicators support a wait-and-see stance: price is above the 20-day average and MACD momentum is positive, but it remains below the 50-day average, while the Stochastic is overbought and resistance is close. The narrowing Bollinger Bands raise the possibility of a larger move without confirming its direction.
- Ideal Entry Range: $69.81–$67.88, between the 20-day average and 20-day support.
- Exit Target (Target Price): $72.63–$73.08, the resistance level and 50-day average.
- Stop Loss: $67.28, the lower Bollinger Band.
- Invalidation: The verdict is invalidated if price falls below $67.88 support.
In plain English, the rebound has momentum, but the trend and nearby resistance have not yet confirmed a stronger advance.
Summary Data UBER
Last price
71.51 USD
Change 1 day / 5 days / 1 month
1.81% / 4.99% / -0.22%
Trend / MA-cross
sideways / none
SMA20 / SMA50
69.81 / 73.08
RSI (14) / Stochastic %K
52.6 / 88.3
Bollinger %B / ATR
84% / 1.58
Support / Resistance 20 days
67.88 / 72.63
Data as of
10 October 2026 03:00 WIB
Disclaimer: This technical analysis is generated automatically from exchange data (via Yahoo Finance) and indicators calculated by JournalArta, for information and education only. The verdict and the entry, target and stop-loss levels are not investment advice or a solicitation to buy or sell any security. Investment decisions and their risks rest solely with the reader.