AVGO Stock Gains 4.49% Today, Momentum Weakens
On Agustus 28, 2026: price 371.54 USD, trend sideways, RSI 43.8, support 355.59, resistance 427.76. technical analysis of avgo stock. AVGO Stock Gains — full…
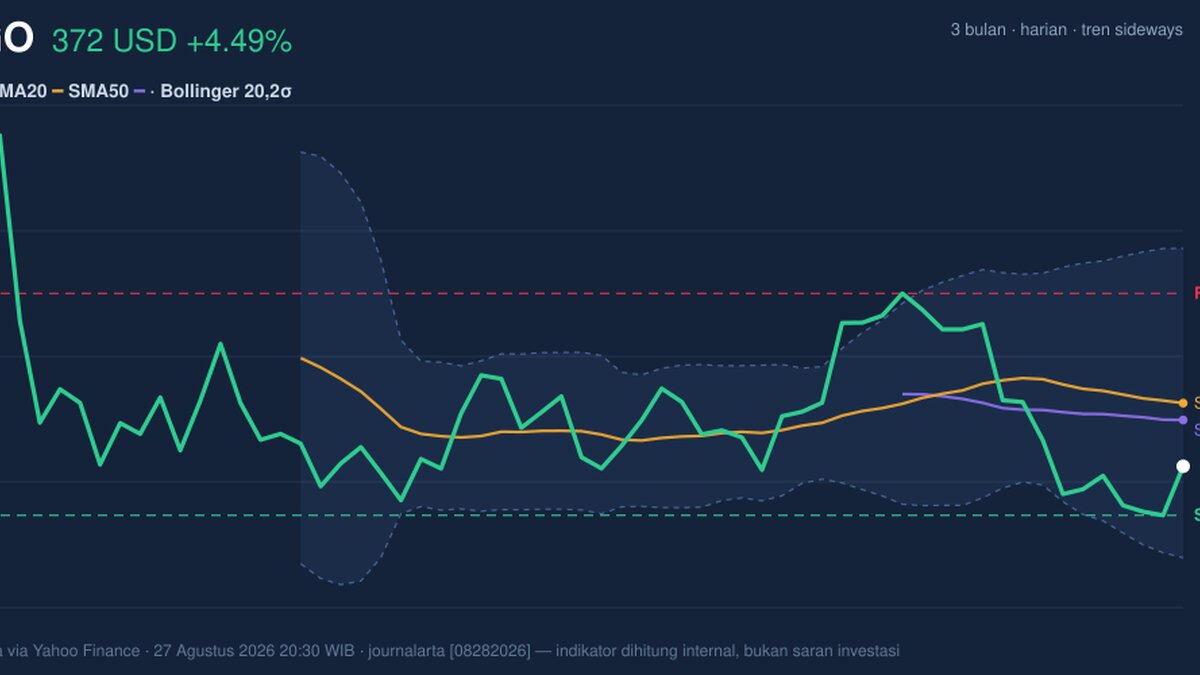
For international investors, Broadcom is trading in a zone where the price has bounced, but the chart still says the burden of proof is on the bulls.
Broadcom Inc. (NASDAQ: AVGO) closed at 371.54 USD, up 4.49% on the day, according to Yahoo Finance data for 27 August 2026 at 20:30 WIB. That rebound matters, but it does not erase the larger message from the chart: the stock is still trading below SMA20 at 392.08 and below SMA50 at 386.59, with no fresh moving-average crossover to signal a clean trend change. In plain terms, AVGO has stopped falling for now, yet it has not convincingly turned the corner.
Trend & Price Action
As shown in the chart, AVGO remains in a sideways trend, and the SMA20 slope of -1.17% over 5 days shows that short-term momentum is still leaning down rather than flattening into a durable base. The stock is sitting at about 22% of its 20-hour range, which places it much closer to support than resistance, but not at a point that would normally imply strength. The 20-hour support at 355.59 is important because it marks the area where buyers have recently defended the price; if that floor gives way, the chart opens back toward the lower part of the broader range, including the 3-month low of 350.06. On the upside, the 20-hour resistance at 427.76 remains the first real test of whether this bounce has legs.
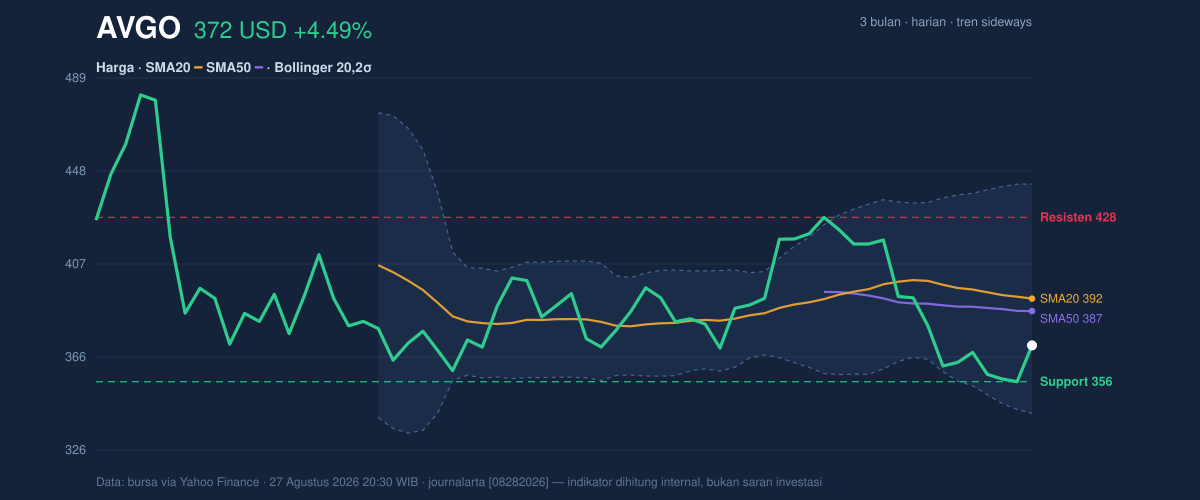
The wider Bollinger band structure helps explain why the recent move feels energetic but not yet decisive. The bands are wide at 25.7%, which points to high volatility rather than calm consolidation. That usually means the next meaningful move can be large, but it does not tell direction by itself. With price still below the middle band at 392.08 and the %B at 30%, AVGO is trading in the lower part of its recent volatility envelope, a sign that the market is still pricing in caution.
Oscillators & Momentum
The momentum picture is mixed, but not in a bullish way. RSI at 43.8 is neutral, which tells readers the stock is neither washed out nor overheated. That matters because a neutral RSI after a bounce often means the market has room to move, but no strong conviction has arrived yet. The Stochastic %K at 26.0 and %D at 11.5 also sit in neutral territory, though the low %D suggests the short-term turn has improved from a weaker position. In other words, the stock is recovering, but the oscillator setup is not yet strong enough to call it a trend reversal.
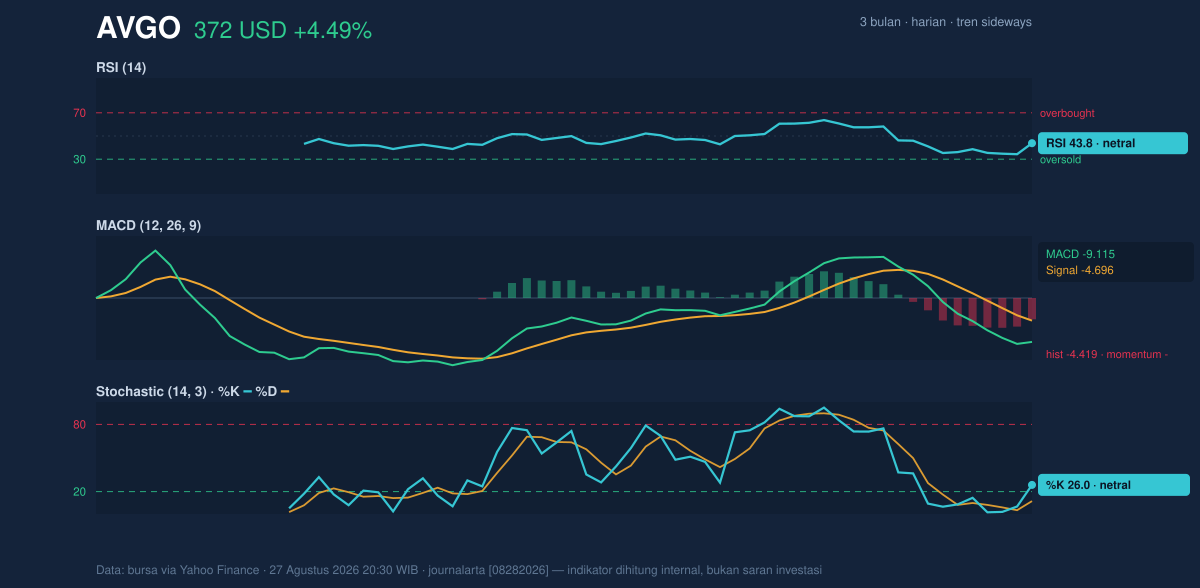
The more telling signal is the MACD at -9.115, still below the signal line at -4.696, with a histogram of -4.419. That combination means downside momentum remains in place even after the day’s rebound. For non-specialist readers, MACD is a trend-following gauge: when it stays negative and below the signal line, it usually means the market has not fully accepted higher prices yet. The key point is that the bounce is happening inside a still-negative momentum structure, not after a confirmed reset.
Volatility & Volume
Volume adds a useful layer of confirmation. The latest trading volume was 21,271,000, about 1.1× normal versus the 20-hour average of 19,601,255. That is enough to say the move was not empty, but not enough to prove a broad accumulation phase. The OBV is falling, which is a warning sign because OBV, or on-balance volume, is designed to show whether volume is flowing into the stock over time. A declining OBV while price rebounds often means the rally is not yet backed by sustained buying pressure.
The ATR(14) at 13.26, equal to 3.6% of price, reinforces the idea that AVGO is currently in a high-volatility environment. ATR measures how much a stock typically moves in a day, so a higher reading means wider swings and less predictable intraday behavior. In practical terms, that makes the current setup more sensitive to headlines, sector rotation, or any shift in semiconductor sentiment.
Key Levels & Scenarios
The chart structure is fairly clear. 355.59 is the immediate support to watch, while 392.08 and 386.59 form the first overhead technical barriers. Above that, 427.76 is the next resistance zone, and the 3-month high of 495.00 marks the broader upper boundary of the recent range. Because the stock is still below both major moving averages, any move higher first needs to reclaim those levels before the market can talk seriously about trend repair.
If AVGO can hold 355.59 and push back through 386.59 and 392.08, the chart would begin to shift from defensive to constructive. If it fails to hold 355.59, the recent rebound loses its technical base and the market is likely to revisit the lower end of the 3-month range.
Technical Verdict: HOLD (wait & see)
HOLD (wait & see) is the cleanest reading from the current setup.
- MACD remains negative, so downside momentum has not fully cleared.
- Price is below SMA20 and SMA50, which means the stock has not yet reclaimed its short- or medium-term trend lines.
- Volume is only 1.1× normal and OBV is falling, so the bounce lacks strong participation.
Verdict invalidated if price falls below 355.59.
- Ideal entry range: 355.59 to 371.54
- Exit target: 386.59 to 392.08
- Stop loss protection: below 355.59
For non-traders, this means the stock has stopped weakening for the moment, but it has not yet proved that the recovery is strong enough to trust.
Summary Data AVGO
| Last price | 371.54 USD |
| Change 1 day / 5 days / 1 month | 4.49% / 2.06% / -4.20% |
| Trend / MA-cross | sideways / none |
| SMA20 / SMA50 | 392.08 / 386.59 |
| RSI (14) / Stochastic %K | 43.8 / 26.0 |
| Bollinger %B / ATR | 30% / 13.26 |
| Support / Resistance 20 days | 355.59 / 427.76 |
| Data as of | 27 Agustus 2026 20:30 WIB |
Track AVGO stock price daily: live levels, support/resistance and our full AVGO analysis history.