CRM RSI Overbought: Stock Gains 22.58% (Agustus 28, 2026)
On Agustus 28, 2026: price 252.05 USD, trend uptrend, RSI 79.8, support 184.02, resistance 252.05. technical analysis of crm stock. CRM RSI Overbought — full…
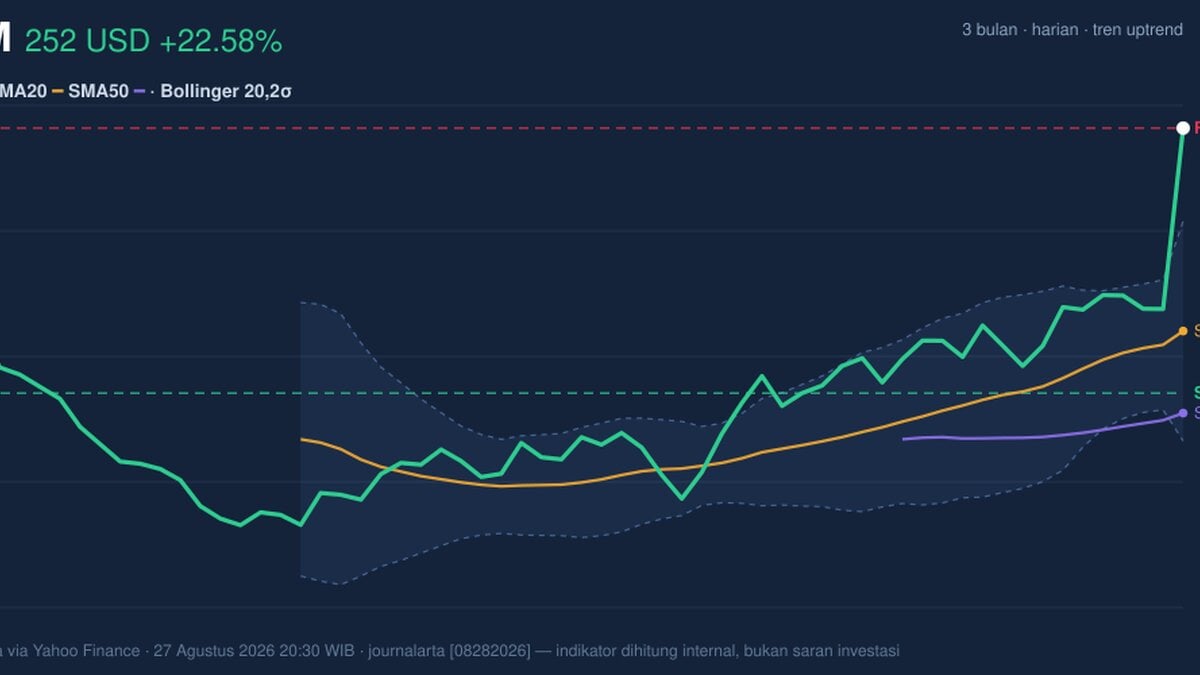
Salesforce rose to 252.05 USD on the NYSE, extending a sharp one-day jump of 22.58% as the stock pushed to the top of its recent trading range. The move matters because it is not just a price pop: the shares are now trading well above short- and medium-term averages, but the momentum gauges are flashing that the advance has become stretched.
Trend & Price Action
The chart shows a stock in a clear uptrend, with the price sitting above both the SMA20 at 199.98 and the SMA50 at 178.87. That positioning tells traders the latest move is not a random spike; it reflects a market that has been willing to pay progressively higher prices over the past several weeks. The SMA20 slope of 5.09% over 5 days adds an important nuance: the short-term trend is still rising, so the average price itself is moving up, not merely being chased by the market.
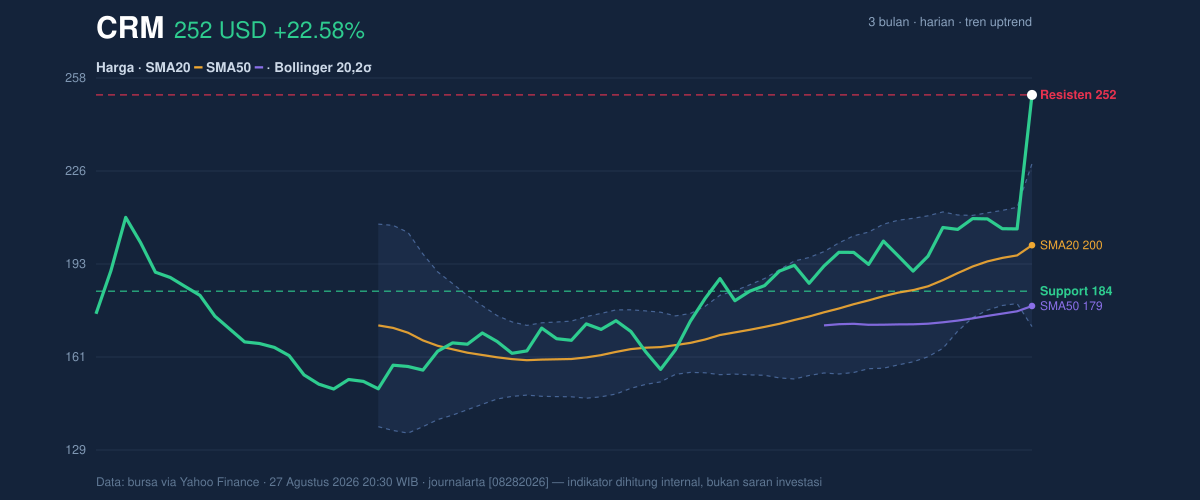
What stands out most is where the stock now sits in relation to its own range. With 252.05 USD matching the reported 20-hour resistance and sitting at 100% of the range, the shares are effectively pressing against the top of the recent structure. That is usually a sign of strength, but it also means much of the near-term upside has already been consumed in a very short period. The 3-month high of 254.48 is only slightly above the current level, so the market is testing an area where prior selling pressure has appeared before.
The Bollinger Bands help explain why the move feels so extended. The upper band is at 228.21, and the price is trading well above it, with %B at 142%. In plain English, that means the stock is not just above its usual trading envelope; it is far outside it. A widening band structure, with 28.2% width, signals that volatility is expanding rather than compressing. That often happens when a stock is repricing quickly, but it also means daily swings can remain unusually large.
Oscillators & Momentum
The momentum chart shows a strong but overstretched setup.
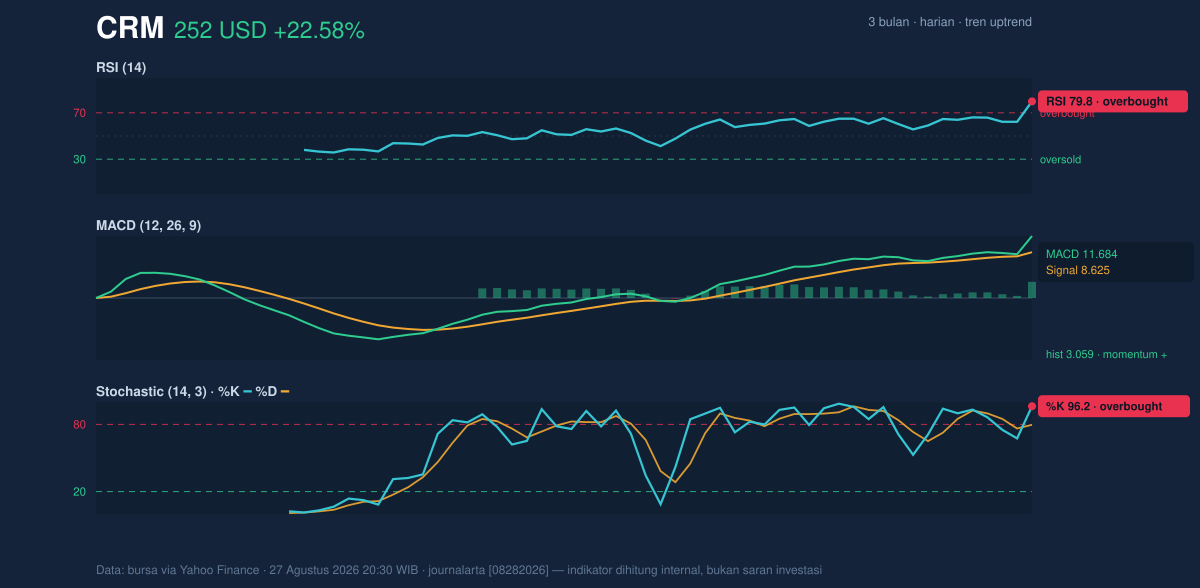
The RSI at 79.8 and the Stochastic %K at 96.2 / %D at 79.7 both sit in overbought territory. For non-specialists, “overbought” does not mean the stock must fall immediately; it means recent buying has been so intense that the market is vulnerable to a pause, consolidation, or a sharp but temporary pullback. In other words, buyers are still in control, but they are no longer buying from a position of comfort.
That warning is balanced by the MACD, which remains constructive. The MACD at 11.684 is above the signal line at 8.625, with a histogram of 3.059. This tells us the trend’s internal momentum is still positive, because the faster-moving average remains ahead of the slower one. The key point is that momentum and oscillators are no longer perfectly aligned: MACD supports the trend, while RSI and Stochastic suggest the move is getting tired near the top of its range.
Volatility & Volume
Volume is confirming that the breakout has real participation behind it. The latest volume of 55,465,200 is about 3.9× the 20-hour average of 14,058,550, and OBV is rising. That combination usually means the move is being supported by broad demand rather than a thin, illiquid push. Rising OBV is particularly useful because it shows volume is accumulating in the direction of price, not fading against it.
At the same time, the ATR(14) of 10.42 — equal to 4.1% of price — says the stock can move a meaningful distance in a single session. High ATR does not predict direction, but it does mean traders should expect wide intraday ranges and less stable price behavior. When paired with an overbought RSI and an expanded Bollinger structure, that volatility can cut both ways: it can extend a breakout, but it can also accelerate a reversal if buyers step back.
Key Levels & Scenarios
The nearest support to watch is the 184.02 level, which marks the lower end of the 20-hour range. If price holds above that area after this surge, the market is signaling that the breakout has enough depth to absorb profit-taking. If it fails, the move starts to look more like an exhaustion spike than a durable trend leg.
Resistance is now immediate at 252.05, with the next reference point the 3-month high of 254.48. A clean push through that zone would tell traders the stock is entering fresh territory rather than simply revisiting a prior peak. But because the price is already stretched far above the Bollinger upper band, any further advance may need continued volume to avoid stalling.
The core message is that Salesforce remains technically strong, but the advance is now extended enough that momentum confirmation and overbought pressure are pulling in opposite directions. That is the kind of setup where the trend is still intact, yet the margin for error has narrowed.
Technical Verdict: HOLD (wait & see)
HOLD (wait & see) because:
- MACD is positive and still above its signal line, which supports the broader uptrend.
- Volume is 3.9× average and OBV is rising, showing strong participation behind the move.
- RSI at 79.8 and Stochastic at 96.2 indicate the stock is stretched and vulnerable to near-term cooling.
Verdict invalidated if price falls below 184.02, because that would break the nearest support and weaken the current range structure.
- Ideal Entry Range: 184.02 to 199.98
- Exit Target (Target Price): 252.05 to 254.48
- Stop Loss protection: below 184.02
For non-traders, this means the stock is strong, but it is also running hot enough that a pause would not be surprising.
Summary Data CRM
| Last price | 252.05 USD |
| Change 1 day / 5 days / 1 month | 22.58% / 22.69% / 39.48% |
| Trend / MA-cross | uptrend / none |
| SMA20 / SMA50 | 199.98 / 178.87 |
| RSI (14) / Stochastic %K | 79.8 / 96.2 |
| Bollinger %B / ATR | 142% / 10.42 |
| Support / Resistance 20 days | 184.02 / 252.05 |
| Data as of | 27 Agustus 2026 20:30 WIB |
Track CRM stock price daily: live levels, support/resistance and our full CRM analysis history.