DBS Stock Drops 0.98% Today, Momentum Weakens
On Agustus 28, 2026: price 75.65 SGD, trend uptrend, RSI 60.5, support 73.55, resistance 76.99. technical analysis of dbs stock. DBS Stock Drops — full details…
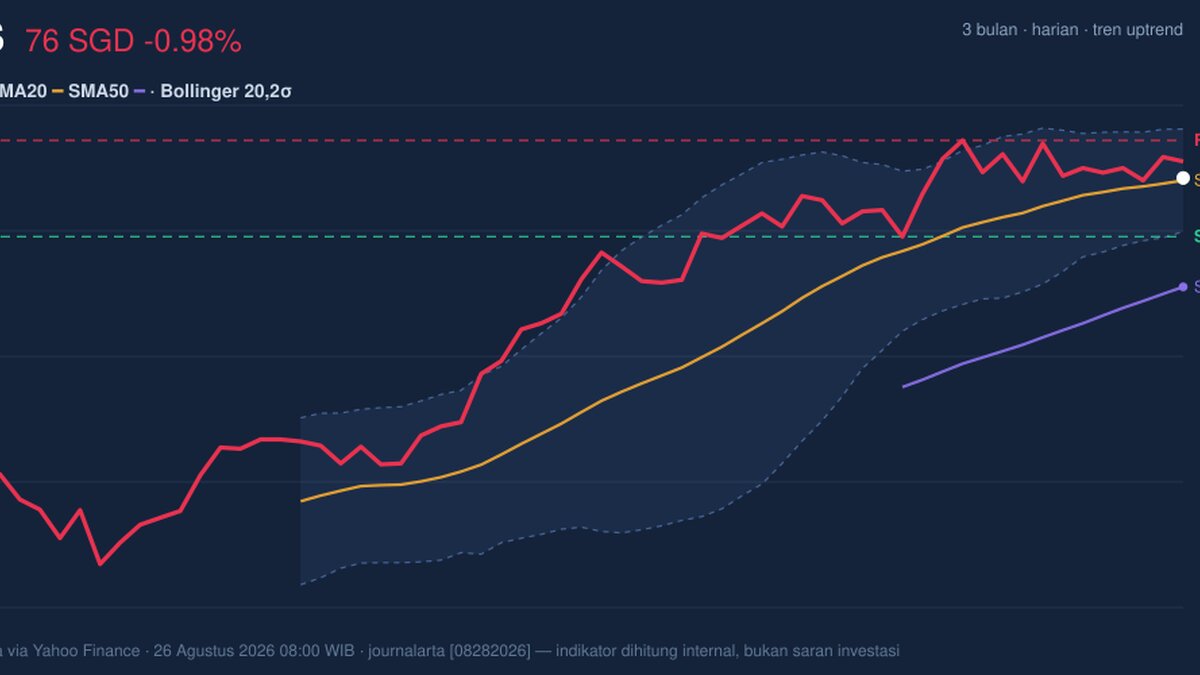
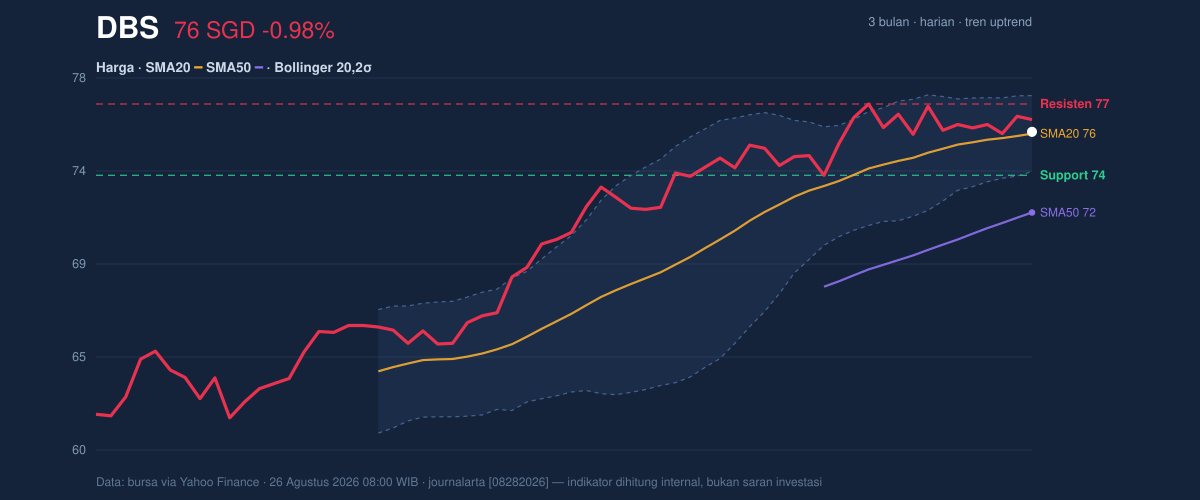
DBS Group’s shares were last quoted at 75.65 SGD on SGX, slipping 0.98% from the previous close of 76.40 even as the broader technical setup still points to an uptrend. The stock is trading above its SMA20 at 75.56 and well above the SMA50 at 71.75, which means the medium-term structure remains constructive. But the latest move also shows a market that is no longer pushing cleanly higher: momentum has cooled, volume is lighter than usual, and the chart is now compressing into a tighter range, a combination that often precedes a sharper move rather than a quiet drift.
Trend & Price Action
As shown in the chart, DBS is still positioned on the stronger side of its recent trend structure. The share price sits just above the SMA20, which is important because that line often acts as a short-term balance point between buyers and sellers. The fact that the price remains far above the SMA50 tells us the larger trend has not broken down; instead, the stock is pausing after a run that has left it near the upper half of its recent band.
The 20-hour support at 73.55 and resistance at 76.99 frame the current battle. At 61% of the range, DBS is leaning closer to resistance than support, but not so stretched that the chart looks exhausted. The 3-month high of 77.97 is close enough to matter: it signals that the stock is moving in the upper part of its longer range, yet still has room before it reaches a fresh ceiling.
A short pullback is not the same as a trend break.
Oscillators & Momentum
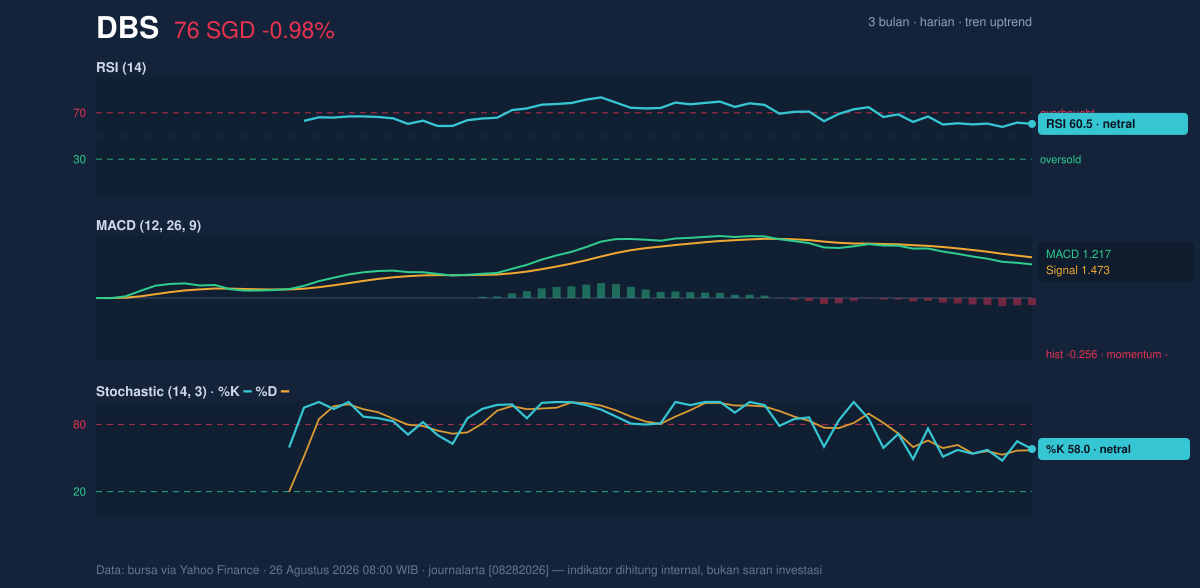
The momentum picture is more mixed, and that matters. The RSI at 60.5 is neutral-to-firm rather than overbought, which suggests the stock still has positive undertone without being overstretched. The Stochastic %K at 58.0 and %D at 56.9 also sit in neutral territory, showing neither a deep oversold rebound nor a hot overbought breakout setup. In plain terms, the oscillators are not flashing danger, but they are also not confirming a fresh surge.
The more cautionary signal comes from MACD. DBS shows MACD at 1.217 below the signal line at 1.473, with a histogram of -0.256. That means short-term momentum has slipped under its own trend signal, a classic sign that the pace of buying is slowing even while the broader trend remains intact. This is not yet a full reversal signal, but it does tell readers that the stock is relying more on support from its moving averages than on active upward acceleration.
Momentum is not broken. It is just less convincing than the trend.
Volatility & Volume
The Bollinger Bands help explain why the stock may be approaching a decision point. With the upper band at 77.40, the middle band at 75.56, and the lower band at 73.73, DBS is sitting almost exactly on the midline. The %B at 52% says price is neither pressing the top of the band nor leaning on the lower edge. More importantly, the 4.9% band width is narrowing, a squeeze pattern that often reflects reduced indecision before a breakout or breakdown. Narrow bands do not predict direction on their own; they simply tell traders that the market is storing energy.
The volume backdrop reinforces that idea. Last volume was 3,105,250, only 0.7× the 20-hour average of 4,533,398. Lower turnover during a small decline suggests the selling is not being backed by strong conviction. That is supported by the OBV rising, which indicates cumulative buying pressure has not disappeared even though the last session softened. In other words, the tape is quieter, but the underlying participation trend has not fully rolled over.
Volatility is present, but commitment is thin.
Key Levels & Scenarios
The immediate map is straightforward. 76.99 is the first resistance to watch, and a move through that area would place the stock back near the 77.40 Bollinger upper band and then toward the 77.97 three-month high. On the downside, 75.56 is the pivot because it matches the SMA20 and Bollinger midline; losing it would weaken the short-term trend balance. Below that, 73.73 becomes the next technical floor, with 73.55 as the nearby support band that has to hold to keep the current structure intact.
The key signal is not just where DBS trades, but how it behaves around these levels. If price can reclaim and hold above 76.99, the squeeze setup would start to look like a release of stored momentum. If it fails to hold 75.56, the chart would shift from consolidation to a more defensive posture.
Technical Verdict: HOLD (wait & see)
HOLD (wait & see)
- Reason 1: The broader trend remains positive because price is above SMA20 and SMA50, with the SMA20 still rising.
- Reason 2: MACD is negative versus its signal line, showing momentum has softened even though the trend has not failed.
- Reason 3: Bollinger Bands are squeezing and volume is below average, which often means the next move may be sharper but is not yet confirmed.
- Verdict invalidated if price falls below 73.55, where the nearest support gives way and the short-term structure weakens materially.
- Ideal Entry Range: 75.56 to 73.73
- Exit Target (Target Price): 76.99 to 77.40
- Stop Loss protection: below 73.55
In plain English, DBS is still technically healthy, but the chart is waiting for proof that buyers can turn a quiet consolidation into another push higher.
“The next move will matter more than the last one.”
Summary Data DBS
| Last price | 75.65 SGD |
| Change 1 day / 5 days / 1 month | -0.98% / -0.46% / 2.35% |
| Trend / MA-cross | uptrend / none |
| SMA20 / SMA50 | 75.56 / 71.75 |
| RSI (14) / Stochastic %K | 60.5 / 58.0 |
| Bollinger %B / ATR | 52% / 1.33 |
| Support / Resistance 20 days | 73.55 / 76.99 |
| Data as of | 26 Agustus 2026 08:00 WIB |
Track DBS share price daily: live levels, support/resistance and our full DBS analysis history.