OCBC Stock Drops 1.87% Today, Momentum Weakens
On Agustus 28, 2026: price 30.90 SGD, trend uptrend, RSI 67.9, support 28.63, resistance 31.79. technical analysis of ocbc stock. OCBC Stock Drops — full…
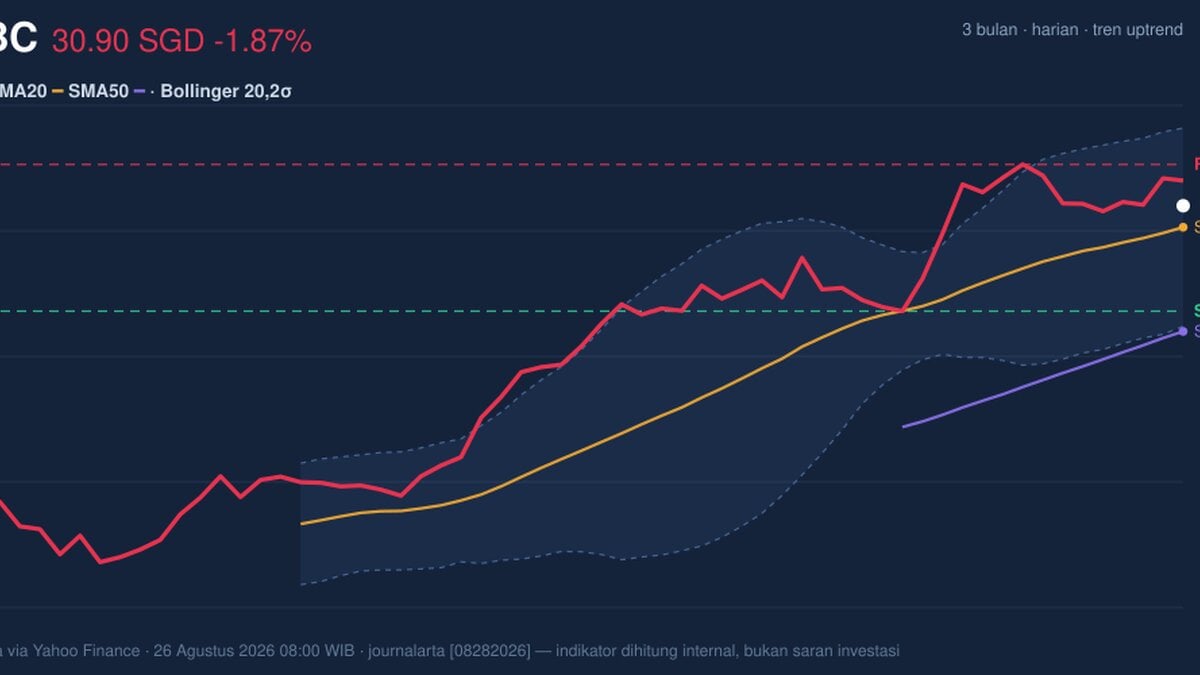
OCBC Bank’s Singapore-listed shares slipped to SGD 30.90 on 26 August 2026, down 1.87% from the previous close of 31.49, even as the stock remained above its short- and medium-term trend lines, according to SGX-linked market data via Yahoo Finance. The pullback is notable not because it breaks the trend, but because it arrives after a month-long climb of 6.81%, suggesting the market is pausing to test how much of the recent advance is already priced in.
Trend & Price Action
The broader structure still points upward. OCBC is trading above its SMA20 at 30.44 and well above its SMA50 at 28.20, which means the share price remains in a constructive position relative to both the short-term and intermediate trend. The uptrend label is also supported by the SMA20 slope, which is rising at 1.71% over 5 days. That matters because a rising moving average usually signals that buyers have been willing to pay progressively higher prices, not just that the stock has bounced once.
There is, however, no fresh moving-average crossover to reinforce a new leg higher. In practical terms, the chart has not delivered a new technical catalyst; it is still working off the earlier trend. As shown in the chart, price is sitting around 72% of the 20-hour range, which places it closer to resistance than support. That positioning often means the market is stretched enough for short-term profit-taking, but not weak enough to imply a trend break.
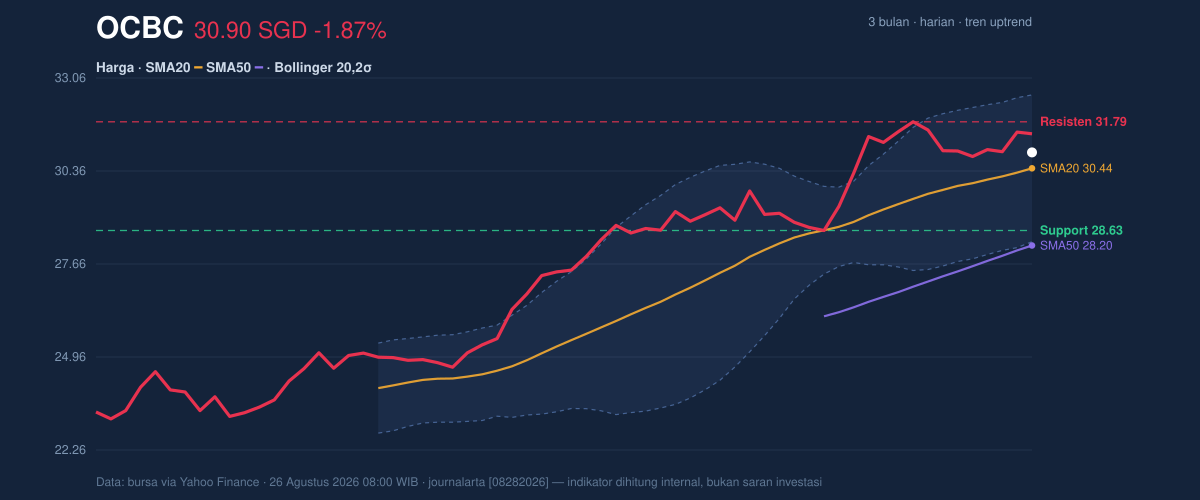
The nearby ceiling is clear at SGD 31.79, while the nearest floor is SGD 28.63. With the stock still below the 3-month high of 31.86 but far above the 3-month low of 23.11, OCBC is trading in the upper part of its recent range. That is usually a sign of resilience, yet also a reminder that upside now requires fresh demand rather than simply continuation of the existing drift.
Oscillators & Momentum
The momentum picture is more mixed than the trend picture. RSI at 67.9 is close to the upper end of neutral and edging toward overbought territory, which tells readers that the stock has already absorbed a fair amount of buying interest. RSI at this level does not mean reversal by itself, but it does mean the shares are less likely to sprint higher without a pause.
The Stochastic oscillator is more stretched, with %K at 87.3 and %D at 82.7. That combination is typically read as overbought, and it often appears when a stock has been rising faster than its short-term momentum can comfortably sustain. In plain language: the stock may still be trending up, but the pace looks tired.
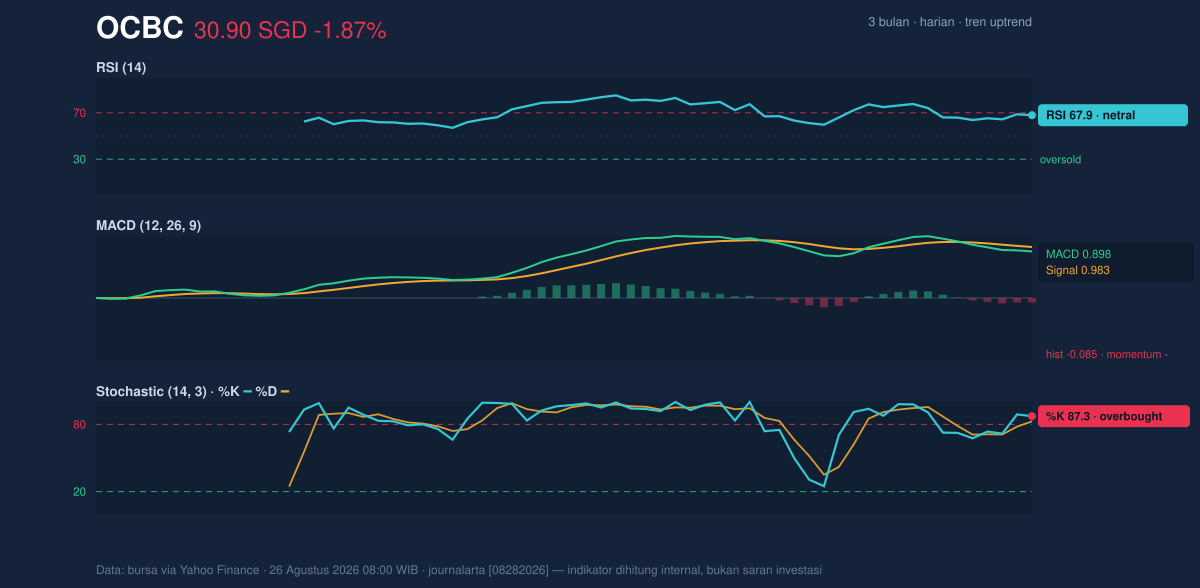
The most important warning comes from MACD at 0.898, which sits below its signal line at 0.983, with a histogram of -0.085. MACD is a trend-following momentum gauge, and when the histogram turns negative it means the upward push is losing force even if the price has not yet rolled over. That divergence matters here because it contrasts with the still-positive moving-average setup. The chart is therefore showing a market that is rising on structure, but cooling on momentum.
Volatility & Volume
Volatility is not unusually high. The ATR(14) of 0.71, equal to 2.3% of price, suggests the stock is moving with moderate daily range rather than sharp disorderly swings. Bollinger Bands also point to a normal environment: the band width of 14.0% is described as normal, not compressed or expanded, which means the market is neither coiling for a breakout nor already in a volatility spike.
Price is trading above the middle band at 30.44 and below the upper band at 32.57, with %B at 61%. That placement says OCBC is in the upper half of its recent volatility envelope, but not pressing the top edge. In other words, the stock is still in an orderly uptrend, yet it has not proven enough strength to challenge the upper band decisively.
Volume, though, is a caution flag. The latest turnover of 3,512,100 shares is only about 0.5× the 20-hour average of 6,956,724, and OBV is falling. That combination signals lighter participation on the recent move. When price is near the upper part of its range but volume is below average, the rally is less convincing because fewer market participants are backing it. Falling OBV reinforces that point: cumulative volume flow is not confirming the price tone.
Key Levels & Scenarios
The immediate battle line is between SGD 31.79 resistance and SGD 28.63 support. A clean move above resistance would matter because it would push the stock through the top of its 20-hour range and closer to the 3-month high of 31.86. Failure there would leave the shares vulnerable to a pullback toward the SMA20 at 30.44, which is also the Bollinger middle band and therefore a natural magnet if momentum fades.
If the stock loses the 30.44 area, the chart would shift from “uptrend with fading momentum” to “trend under pressure.” If it breaks below 28.63, the current bullish structure would be materially weakened, because that level is the nearest support on the chart and a clear reference for where buyers have recently stepped in.
Technical Verdict: HOLD (wait & see)
HOLD (wait & see)
- Trend support remains intact: price is above the SMA20 at 30.44 and SMA50 at 28.20, keeping the broader structure constructive.
- Momentum is fading: MACD is below signal and the histogram is negative, while Stochastic is overbought.
- Participation is weak: volume is running at 0.5× the 20-hour average and OBV is declining, so the latest move lacks confirmation.
- Invalidation condition: this verdict is invalidated if price falls below SGD 28.63, the nearest support.
- Ideal entry range: SGD 30.44 to SGD 28.63
- Exit target: SGD 31.79 to SGD 32.57
- Stop loss protection: below SGD 28.63
For non-traders, that means OCBC still looks technically healthy, but the chart is waiting for either stronger confirmation above resistance or a clearer loss of support.
Summary Data OCBC
| Last price | 30.90 SGD |
| Change 1 day / 5 days / 1 month | -1.87% / -0.13% / 6.81% |
| Trend / MA-cross | uptrend / none |
| SMA20 / SMA50 | 30.44 / 28.20 |
| RSI (14) / Stochastic %K | 67.9 / 87.3 |
| Bollinger %B / ATR | 61% / 0.71 |
| Support / Resistance 20 days | 28.63 / 31.79 |
| Data as of | 26 Agustus 2026 08:00 WIB |
Track OCBC share price daily: live levels, support/resistance and our full OCBC analysis history.