Testing Support Level, HD Stock Drops 1.86% Today
On Agustus 28, 2026: price 328.61 USD, trend sideways, RSI 40.7, support 328.61, resistance 355.62. technical analysis of hd stock. Testing Support Level —…
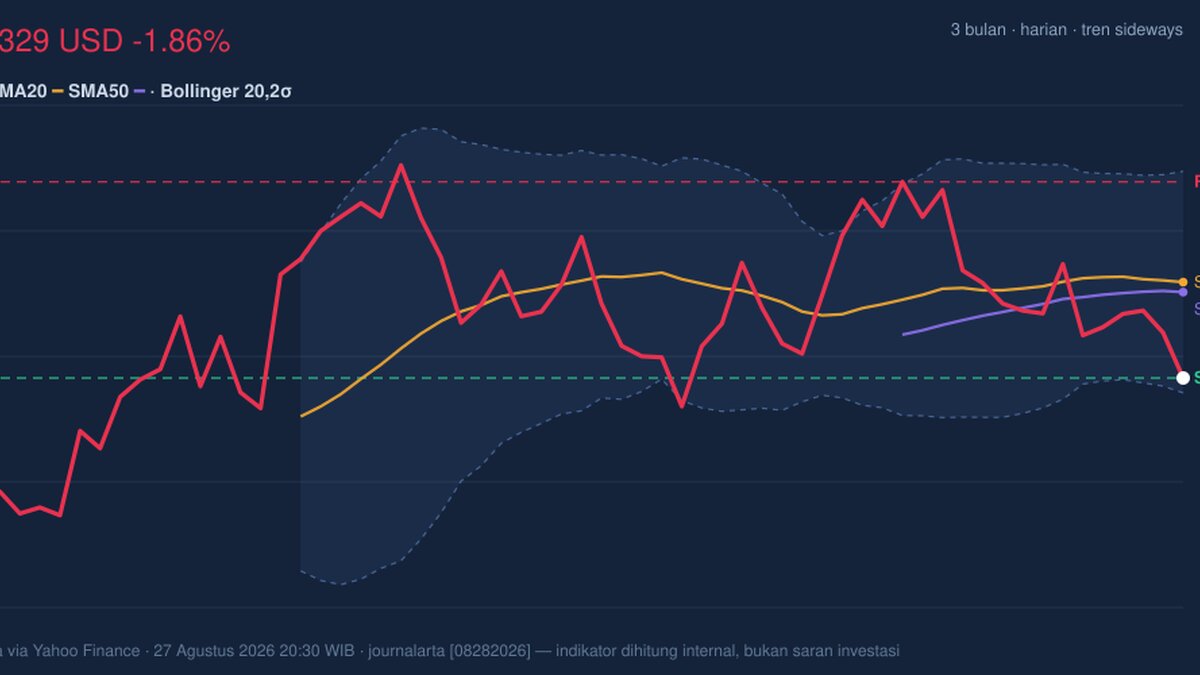
Home Depot fell to 328.61 on the NYSE, down 1.86% from the prior close of 334.85, as the shares slipped back to the bottom of their recent trading band, according to data from Yahoo Finance. The move matters less as a one-day drop than as a signal: the stock is now sitting just above its 20-day support at 328.61 while still trading below both short- and medium-term trend lines, a setup that suggests the market is testing whether demand is strong enough to defend the lower edge of the range.
Trend & Price Action
The broader pattern is still sideways, but the chart shows that sideways does not mean stable. Home Depot is trading below its SMA20 at 341.81 and below its SMA50 at 340.43, which tells traders that recent prices have lost the ability to hold above the average cost bases of the last month and roughly the last quarter. In practical terms, when a stock sits under both averages, rallies often meet sellers who used those levels to exit on strength. The lack of a fresh MA-cross also matters: there is no new moving-average signal to suggest trend reversal, so the burden remains on price to prove it can recover back above the mid-band first.
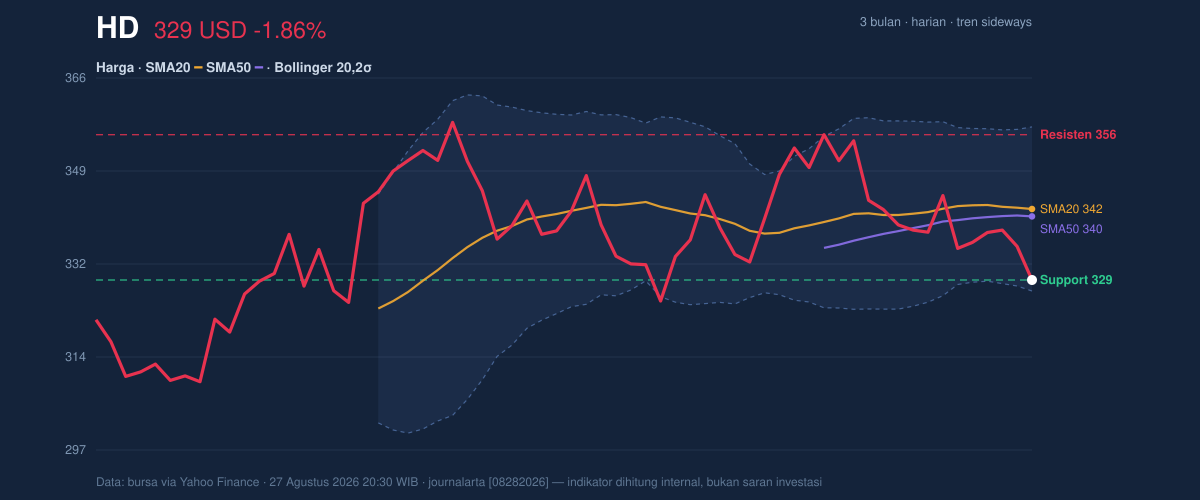
The Bollinger Band structure reinforces that message. With the lower band at 326.57, the middle band at 341.81, and the upper band at 357.06, the stock is pressing near the bottom of its normal volatility envelope. A %B of 7% means price is hugging the lower end of the band structure, which is often where short-term exhaustion can appear — but only if buyers actually step in. Right now, the price is not showing that recovery yet. It is simply parked at the edge.
The three-month range gives the move more context: the stock has traded between 307.07 and 358.85, and at 328.61 it is much closer to the low than the high. That positioning signals caution rather than panic. Home Depot is not breaking down in a disorderly way, but it is still trading in the lower half of its recent range, which usually means the market is waiting for a catalyst before re-rating the shares higher.
Oscillators & Momentum
Momentum is mixed, and that split is the key to reading the chart. The RSI at 40.7 is neutral, meaning the stock is neither stretched enough to be called overbought nor weak enough to be decisively oversold. By itself, that would suggest indecision. But the stochastic oscillator paints a sharper short-term picture: %K at 2.4 and %D at 14.5 are in oversold territory, which usually implies the stock has been sold hard enough in the near term that a bounce becomes more likely. The catch is that oversold is not the same as bullish; it only says downside may be getting crowded.
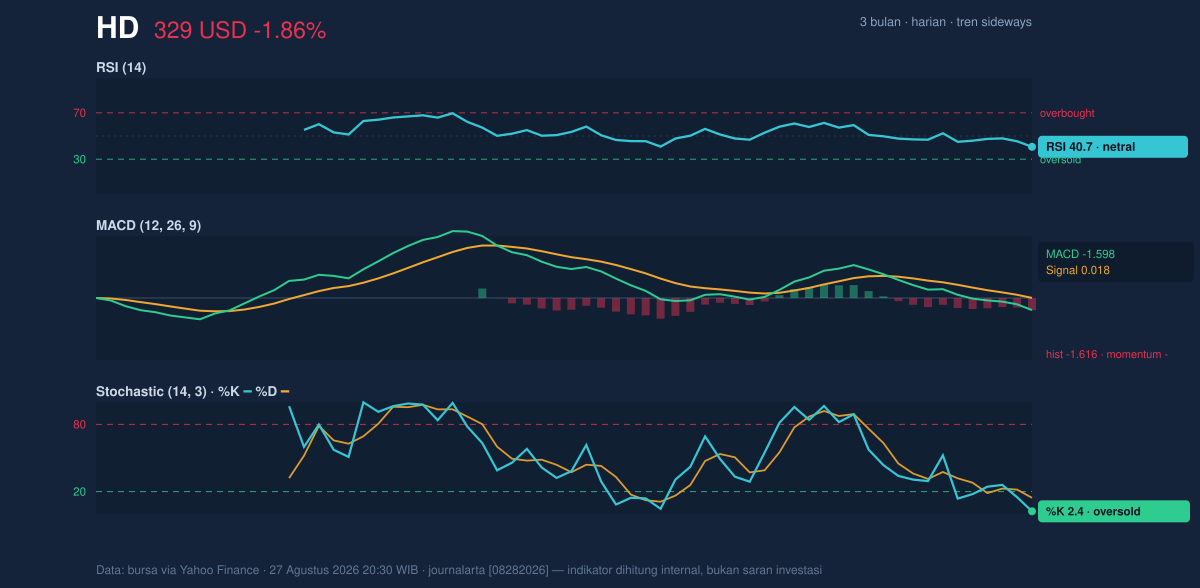
The MACD at -1.598 versus its signal at 0.018, with a histogram of -1.616, is the clearest warning on the page. MACD measures whether recent price momentum is improving or deteriorating; a negative reading with a wide gap below the signal line means downside momentum is still dominant, even if the stock is near support. That combination — oversold stochastic, neutral RSI, negative MACD — often appears when a stock is close to a technical floor but has not yet turned the corner. In other words, the chart is showing pressure, not confirmation of reversal.
Volatility & Volume
Volatility is present, but not extreme. The ATR at 8.36, equal to 2.5% of price, indicates a normal daily trading environment rather than a disorderly one. That matters because a stock with moderate ATR can still move sharply, but it tends to do so within a range that traders can map more cleanly. The Bollinger Band width of 8.9% is also described as normal, which suggests the stock is not in a volatility squeeze that would typically precede a large breakout. Instead, the current setup looks like a stock drifting toward the lower boundary of a familiar corridor.
Volume does not yet confirm a strong institutional shift. Last volume was 3,618,000, slightly below the 20-day average of 3,747,680, or about 1.0× normal. That means the latest drop was not accompanied by a clear surge in participation, which reduces the odds that this was a decisive breakdown. Still, OBV is falling, and that is important: on-balance volume tracks whether volume is accumulating on up days or down days, so a declining OBV implies selling pressure has been outweighing buying interest over time. Price may be near support, but participation has not yet turned in its favor.
Key Levels & Scenarios
The immediate line in the sand is the 328.61 support, which is also the current price. If that level gives way, the next reference from the data is the 326.57 lower Bollinger band, and a failure there would expose the lower end of the three-month range at 307.07. On the upside, the first meaningful hurdle is 341.81, the SMA20 and Bollinger middle band, because reclaiming that level would show the stock has recovered the average short-term price. Above that, the chart points to 355.62 resistance and then the 357.06 upper Bollinger band, where rallies would likely need stronger momentum to continue.
The core message is that Home Depot is testing support with weak momentum but not yet showing the volume or trend reversal needed to confirm a durable turn.
Technical Verdict: HOLD (wait & see)
HOLD (wait & see)
- MACD is negative and still below its signal line, showing momentum remains weak.
- Price is below SMA20 and SMA50, so the stock has not regained its short-term trend structure.
- Stochastic is oversold, which can support a bounce, but the signal is not confirmed by RSI or volume.
Verdict invalidated if price falls below 326.57.
- Ideal Entry Range: 326.57 to 328.61
- Exit Target: 341.81, then 355.62
- Stop Loss protection: below 326.57
In plain English: the chart says the stock is close to a floor, but it has not yet proven that buyers are back in control.
The next scheduled read on that test will come when Home Depot’s shares either reclaim 341.81 or lose 326.57.
Summary Data HD
| Last price | 328.61 USD |
| Change 1 day / 5 days / 1 month | -1.86% / -1.76% / -1.42% |
| Trend / MA-cross | sideways / none |
| SMA20 / SMA50 | 341.81 / 340.43 |
| RSI (14) / Stochastic %K | 40.7 / 2.4 |
| Bollinger %B / ATR | 7% / 8.36 |
| Support / Resistance 20 days | 328.61 / 355.62 |
| Data as of | 27 Agustus 2026 20:30 WIB |
Track HD stock price daily: live levels, support/resistance and our full HD analysis history.