Testing Support Level, UOB Stock Drops 1.14% Today
On Agustus 28, 2026: price 40.64 SGD, trend sideways, RSI 41.8, support 40.22, resistance 43.89. technical analysis of uob stock. Testing Support Level — full…
United Overseas Bank’s shares on SGX slipped to SGD 40.64 on 26 August 2026, down 1.14% from the previous close of SGD 41.11, and the chart now shows a stock that is still trading below its short- and medium-term trend lines while failing to attract strong turnover. The price is sitting in the lower part of its recent range, with the market reading a cautious tone rather than a decisive breakdown, because momentum is weak but not yet washed out.
Trend & Price Action
As shown in the chart, UOB is in a sideways trend, but that flat label masks a softer short-term bias: the SMA20 at SGD 42.06 is above the latest price, and the SMA50 at SGD 41.86 is also overhead. In plain terms, the shares are trading below both of the commonly watched averages that often act like dynamic ceilings when sentiment is fragile.
That matters because price action below the moving averages usually means rallies are being sold into rather than chased. The SMA20 slope of -1.46% over 5 days reinforces that message: the near-term trend is leaning down, even if the broader pattern is still range-bound. There is no new MA-cross, so the chart is not signaling a fresh trend reversal; instead, it is showing a market waiting for a catalyst.
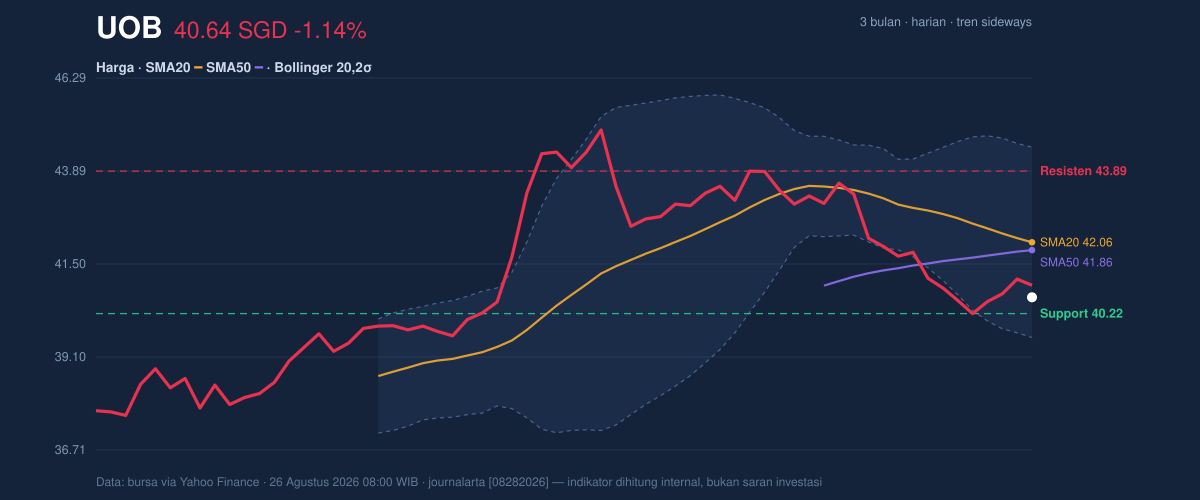
The Bollinger setup adds another layer. UOB is near the lower half of its band structure, with the lower Bollinger band at SGD 39.60, the middle at SGD 42.06, and the upper at SGD 44.51. A %B reading of 21% means the share price is hovering close to the lower band, which often indicates pressure is concentrated on the downside, but not necessarily that a rebound is imminent. The 11.7% band width is normal, suggesting the stock is not in a volatility squeeze that would typically precede a sharp breakout.
Oscillators & Momentum
The momentum gauges are mixed, but the balance still tilts cautious. The RSI(14) at 41.8 is neutral, which tells us the stock is not oversold enough to signal a strong contrarian bounce, nor overbought enough to imply exhaustion. The Stochastic %K at 29.6 and %D at 29.1 are also neutral, but they sit near the lower end of the scale, which usually means price is weak without yet entering a textbook reversal zone.
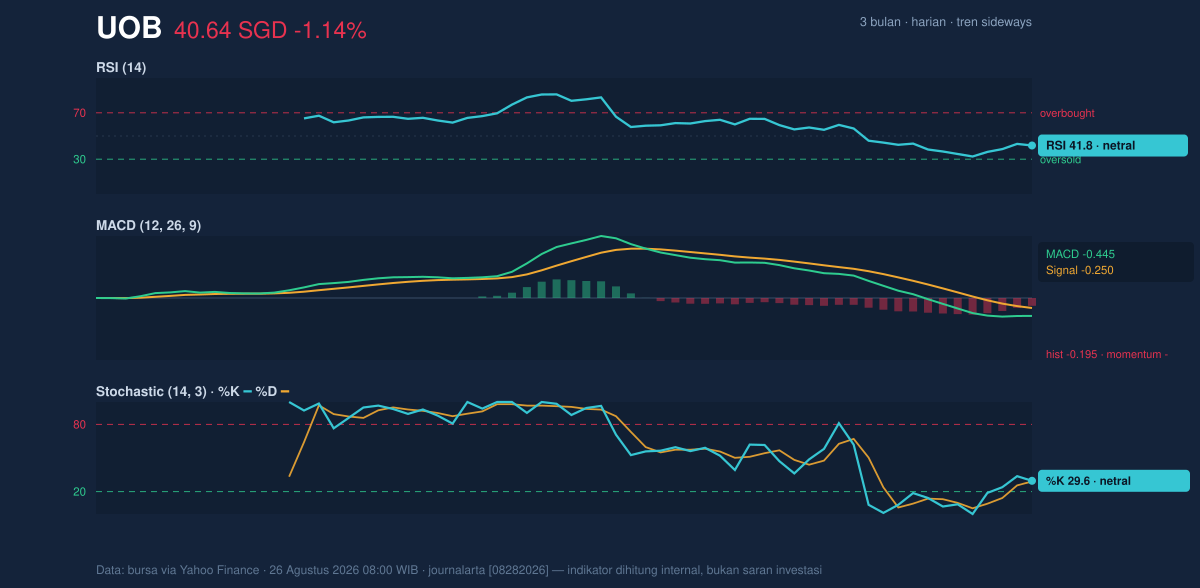
The more important signal is the MACD at -0.445, below its signal line at -0.250, with a histogram of -0.195. That configuration means downside momentum still outweighs upside momentum; the gap between MACD and signal line shows the recent price trend has not stabilized enough to claim a genuine turn. In simple terms, the stock is drifting lower faster than momentum indicators are recovering.
Volatility & Volume
Volatility is present, but not extreme. The ATR(14) at 0.66, equal to 1.6% of price, points to moderate daily movement rather than a disorderly selloff. That gives the chart room to swing, but not enough to suggest a dramatic price shock is already underway.
Volume, however, is the clearest warning sign. The latest turnover of 1,592,000 shares is only 0.4× the 20-day average of 3,690,325. Low participation during a weak price move often means there is not yet a strong conviction selloff, but it also means buyers are not stepping in with force. The OBV is down, which is important because on-balance volume tracks whether money flow is supporting the price; when OBV falls while price is soft, it suggests distribution is still outweighing accumulation.
Key Levels & Scenarios
The nearest map is straightforward. Support sits at SGD 40.22, while resistance stands at SGD 43.89. The current price is positioned about 11% into that range, closer to support than resistance, which means the market is leaning defensively rather than testing an upside breakout.
The 3-month high at SGD 45.15 and 3-month low at SGD 37.52 frame the broader trading corridor. With price below the moving averages and near the lower band, a failure to hold the current support area would likely leave the stock vulnerable to a move back toward the lower end of that 3-month band. On the other hand, a recovery above the short-term resistance would need to be backed by stronger volume to matter; without participation, breakouts can fade quickly.
Technical Verdict: HOLD (wait & see)
HOLD (wait & see)
- MACD remains negative, showing downside momentum still has the upper hand.
- Price is below SMA20 and SMA50, which means the stock is still trading under short- and medium-term trend pressure.
- Volume is only 0.4× average and OBV is down, so there is no strong confirmation of accumulation.
Verdict invalidated if price falls below SGD 40.22, because that would break the nearest support and weaken the current range structure.
- Ideal Entry Range: SGD 40.22 to SGD 41.00
- Exit Target: SGD 43.89
- Stop Loss protection: below SGD 39.60
In plain English, the chart says UOB is not in trouble yet, but it has not shown enough strength to reclaim control from sellers.
Summary Data UOB
| Last price | 40.64 SGD |
| Change 1 day / 5 days / 1 month | -1.14% / 0.20% / -5.80% |
| Trend / MA-cross | sideways / none |
| SMA20 / SMA50 | 42.06 / 41.86 |
| RSI (14) / Stochastic %K | 41.8 / 29.6 |
| Bollinger %B / ATR | 21% / 0.66 |
| Support / Resistance 20 days | 40.22 / 43.89 |
| Data as of | 26 Agustus 2026 08:00 WIB |
Track UOB share price daily: live levels, support/resistance and our full UOB analysis history.