TSLA Stock Analysis: Gains 2.60%, Momentum Gains
On Agustus 28, 2026: price 354.81 USD, trend sideways, RSI 53.5, support 311.21, resistance 362.86. technical analysis of tsla stock. TSLA Stock Analysis —…
Tesla rose on the NASDAQ in New York, with TSLA last at $354.81, up 2.60% from the prior close of $345.82 as of 27 August 2026 20:30 WIB. The move puts the stock back into the upper half of its recent trading band, but the chart still shows a market that is improving inside a broader sideways setup rather than breaking into a clean new trend. That matters because, in technical terms, the question is not whether the shares are moving higher today; it is whether buyers are proving they can keep control above the short-term average and push toward the next ceiling.
Trend & Price Action
The price is trading above the SMA20 at $336.94 but still below the SMA50 at $361.43, which is a classic sign of recovery inside a larger consolidation. The absence of a fresh MA-cross means the market has not yet delivered the kind of moving-average confirmation that typically marks a more durable shift in trend. Instead, the current setup looks like a stock that has regained short-term footing while still negotiating a heavier layer of overhead supply near the medium-term average.
That is reinforced by the stated trend: sideways, with the SMA20 slope rising 3.47% over 5 days. A rising short average tells readers that recent prices have been improving, but “sideways” means the broader structure is still range-bound. In plain language, Tesla is climbing inside a corridor, not yet escaping it.
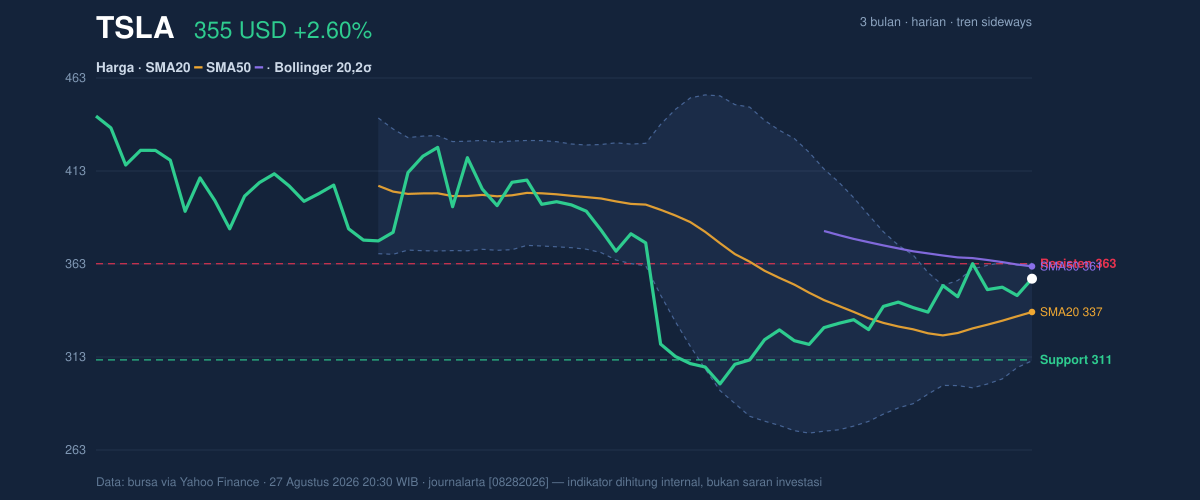
The Bollinger framework shows why that distinction matters. The stock is trading at 84% of the Bollinger range, near the upper part of the band but not at the top edge. With the upper band at $363.13 and the middle band aligned with the SMA20 at $336.94, the chart suggests the shares are leaning bullish in the short term, yet still vulnerable to rejection if they cannot clear the nearby resistance zone.
Oscillators & Momentum
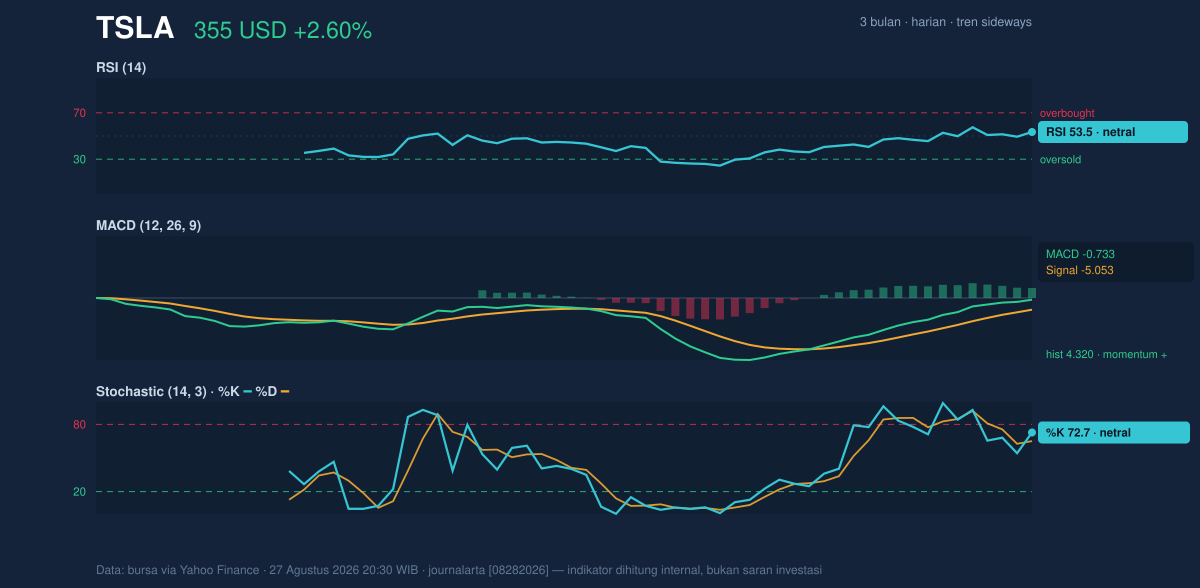
Momentum indicators are mostly constructive, but not euphoric. RSI at 53.5 is neutral, which means Tesla is not stretched into overbought territory and also not showing the kind of weakness that usually accompanies a breakdown. That neutrality often signals a market in balance: buyers have enough strength to keep the price firm, but not enough urgency to force a decisive breakout.
The stochastic oscillator is more upbeat, with %K at 72.7 and %D at 65.0. This places the stock near the higher end of its recent range and suggests short-term momentum is still positive. For general readers, stochastic helps show whether a stock is closing near the top of its recent range; here, it says Tesla has been finishing sessions relatively well, which is consistent with the recent monthly gain of 14.88%.
The MACD picture is the most important part of the momentum setup. MACD is -0.733, but its signal line is -5.053 and the histogram is +4.320. That combination means the faster line is still below zero, yet it has moved above the slower signal line, which is why the histogram is positive. In practical terms, momentum is improving even though the broader trend confirmation has not fully arrived. This is often the stage where traders watch for follow-through rather than chase the first bounce.
Volatility & Volume
Volatility is moderate, not explosive. ATR(14) at 11.88, equal to 3.3% of price, implies Tesla can still make meaningful daily moves, but the tape is not showing panic-style swings. The Bollinger band width of 15.5% is described as normal, which suggests there is room for expansion if a catalyst appears, but no strong squeeze that would usually precede a sharp compression-breakout move.
Volume adds a subtle warning. The latest reading of 30,062,000 shares is below the 20-hour average of 33,358,505, or 0.9x normal. That means the recent advance is not yet being confirmed by heavier-than-usual participation. Price can rise on lighter volume for a while, but sustained breakouts usually need stronger turnover to show that institutions are engaged. The positive piece is that OBV is rising, which indicates net buying pressure has been building over time even if the latest session was not unusually active.
Key Levels & Scenarios
The most immediate technical map is clear. Support at $311.21 marks the lower end of the 20-hour range, while resistance at $362.86 sits just under the Bollinger upper band at $363.13. With the stock currently at $354.81, Tesla is trading in the upper part of its range, meaning the market is close enough to resistance that follow-through matters more than the day’s gain itself.
The 3-month range gives extra context: $443.96 remains the upper boundary from recent history, and $297.38 is the lower anchor. Tesla is still well below the 3-month high, which tells us the stock has not yet reclaimed its full prior momentum, but it is also comfortably above the 3-month low, showing the recovery has real distance behind it.
If Tesla clears $362.86 and holds above it, the chart would suggest a stronger attempt to reassert trend control, especially if volume expands above the recent average. If it fails to hold the mid-$350s and slips back through $336.94, the price would be leaning back toward the middle of the Bollinger structure and the short-term recovery would lose some credibility.
Technical Verdict: HOLD (wait & see)
HOLD (wait & see)
- RSI at 53.5 and stochastic at 72.7 / 65.0 show improving momentum, but not a decisive overbought breakout.
- MACD histogram at +4.320 is positive, yet price remains below the SMA50 at $361.43, so medium-term confirmation is still missing.
- Volume at 0.9x normal means the latest rise is not backed by strong participation, even though OBV is rising.
Verdict invalidated if price breaks below $311.21.
- Ideal Entry Range: $336.94 to $354.81
- Exit Target: $362.86 to $363.13
- Stop Loss Protection: below $311.21
For non-traders, this means Tesla’s chart looks healthier than it did a few sessions ago, but it still needs a stronger push through resistance before the move can be treated as more than a recovery inside a range.
Summary Data TSLA
| Last price | 354.81 USD |
| Change 1 day / 5 days / 1 month | 2.60% / 2.80% / 14.88% |
| Trend / MA-cross | sideways / none |
| SMA20 / SMA50 | 336.94 / 361.43 |
| RSI (14) / Stochastic %K | 53.5 / 72.7 |
| Bollinger %B / ATR | 84% / 11.88 |
| Support / Resistance 20 days | 311.21 / 362.86 |
| Data as of | 27 Agustus 2026 20:30 WIB |
Track TSLA stock price daily: live levels, support/resistance and our full TSLA analysis history.