AVGO Stock Gains 3.71%, Momentum Weakens In Focus
On Agustus 31, 2026: price 368.79 USD, trend sideways, RSI 43.5, support 355.59, resistance 427.76. technical analysis of avgo stock. AVGO Stock Gains — full…
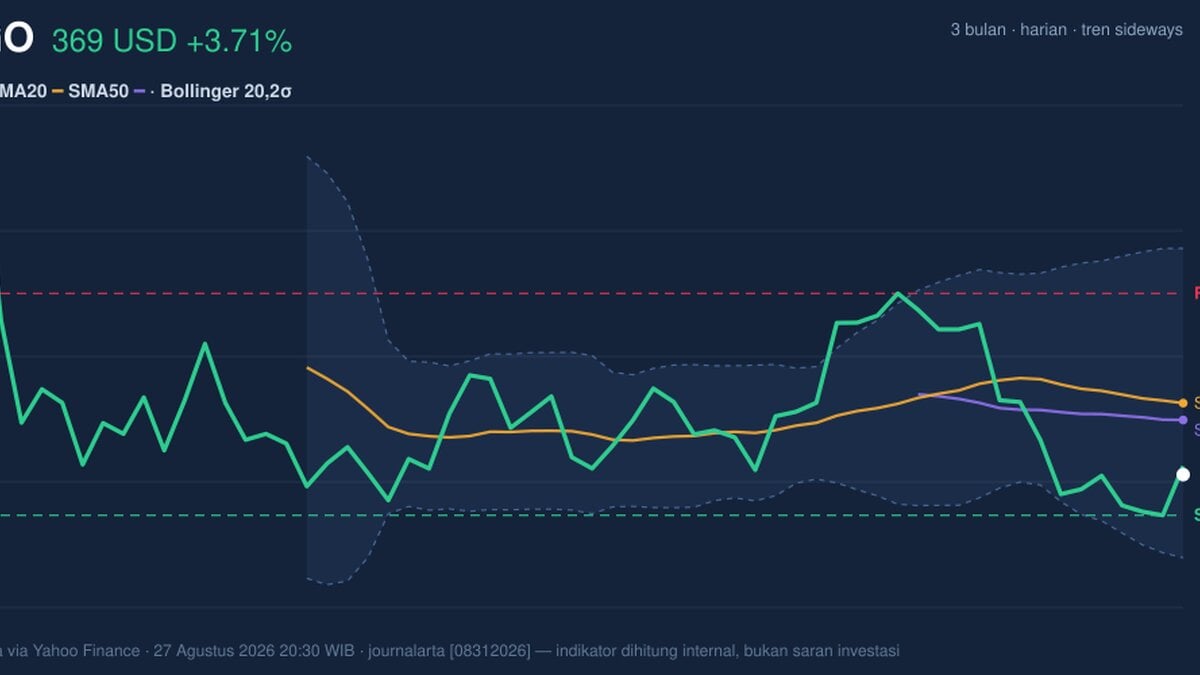
Broadcom is trading in a zone where the market is still pricing in risk, even after a sharp one-day rebound, because the shares remain below the main trend markers and momentum has not yet turned constructive. As shown by the latest Yahoo Finance data for NASDAQ-listed AVGO, the stock closed at 368.79 USD, up 3.71% on the day, but it is still below both the SMA20 at 392.08 and the SMA50 at 386.59. That matters because moving averages often act like a crowd’s memory: when price stays underneath them, rallies tend to be treated as recovery attempts rather than proof of a new trend.
Trend & Price Action
The broader structure is still described as sideways, but the slope of the SMA20 at -1.17% over 5 days shows that the short-term bias is leaning lower rather than stabilizing. In practical terms, that means the recent bounce has not yet changed the path of least resistance. The stock is also sitting in the lower part of its recent trading band, with price at 18% of the 20-hour range between 355.59 and 427.76, which suggests it is closer to support than to resistance, but not yet at a level that would force a decisive reversal.
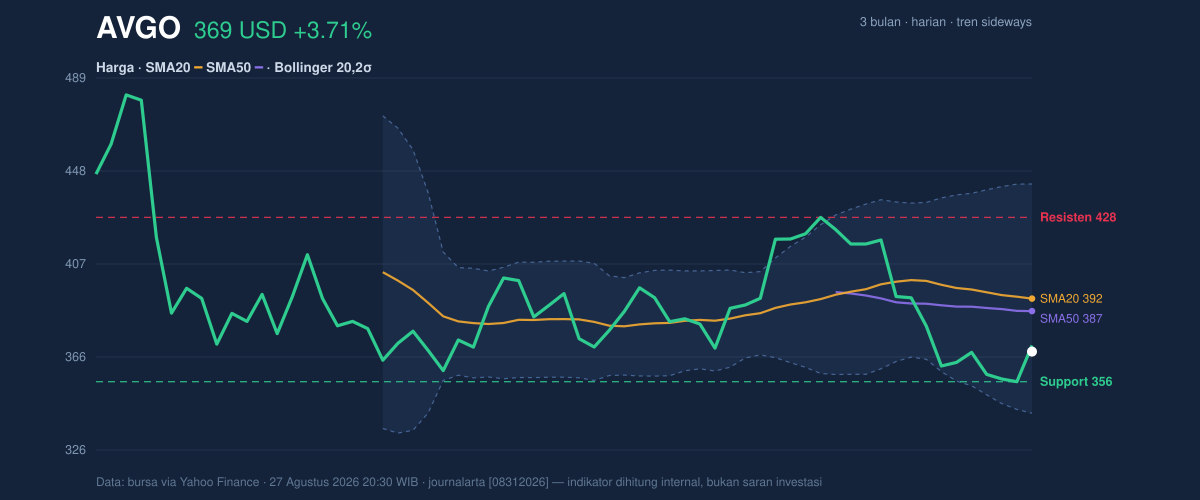
The Bollinger Band setup reinforces that reading. Price is below the middle band at 392.08, while the lower band sits at 341.74 and the upper band at 442.43. A %B of 27% means the share price is positioned in the lower portion of the band structure, a sign that the market is still discounting upside and has not reclaimed the center of the range. At the same time, the 25.7% band width indicates the bands are expanding, which usually signals that volatility is picking up rather than settling down. In plain language, the stock is not coiling quietly; it is moving in a more forceful environment where swings can extend quickly in either direction.
Oscillators & Momentum
The momentum picture is mixed to weak. The RSI at 43.5 is neutral, which means the stock is neither stretched on the upside nor washed out on the downside. That is important because a neutral RSI does not confirm a trend by itself; it simply says the market still has room to move either way. The Stochastic %K at 26.0 and %D at 11.5 are also neutral, but they sit near the lower end of the scale, hinting that short-term selling pressure has eased without yet producing a strong reversal signal.
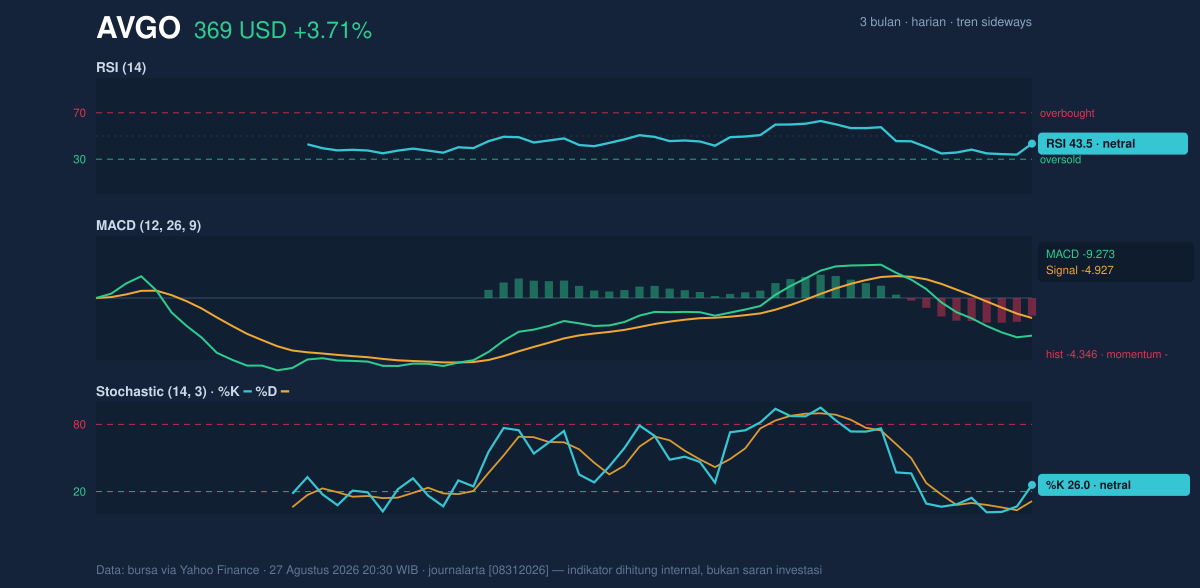
The clearest warning comes from the MACD. With MACD at -9.273, the signal line at -4.927, and a histogram of -4.346, the model is still showing negative momentum. That means the recent bounce has not fully overcome the underlying downward impulse. In technical terms, the MACD remains below its signal line, so the stock is still losing trend energy faster than it is gaining it. For readers less familiar with the indicator: MACD is a trend-following gauge, and a negative histogram usually tells you that bearish pressure is still dominant even if the price has had a good day.
Volatility & Volume
Volatility is elevated. The ATR(14) at 13.26, equal to 3.6% of price, shows the average daily move is wide enough to matter for short-term positioning. That is reinforced by the expanding Bollinger structure. In this kind of setup, a single session can change the technical picture quickly, especially if price tests support or the moving averages.
Volume, however, is only a mild confirmation. Trading volume of 21,330,000 was just 1.1× normal versus the 20-hour average of 19,604,205. That is enough to say the rebound had participation, but not enough to argue that a major trend shift has been validated. The OBV is falling, which is the more important clue: on-balance volume tracks whether shares are being accumulated or distributed over time, and a declining OBV suggests sellers have had the upper hand in the broader flow even when price briefly recovers.
Key Levels & Scenarios
The nearest line in the sand is 355.59, the 20-hour support and also the previous close. If that level fails, the chart opens toward the lower Bollinger band at 341.74, which becomes the next technical area to watch because it marks the edge of the current volatility envelope. On the upside, 386.59 and 392.08 are the first important hurdles, since they are the SMA50 and SMA20 respectively; price usually needs to reclaim those zones before a weak bounce can be treated as something stronger. Above that, 427.76 is the 20-hour resistance, and the upper Bollinger band at 442.43 would be the broader ceiling if momentum improves.
The stock is therefore in a classic test phase: support is close, but trend confirmation is missing. If buyers can push and hold price back above the moving averages, the chart would look less fragile. If not, the current bounce risks fading into another range-bound decline.
Technical Verdict: HOLD (wait & see)
HOLD (wait & see)
- Reason 1: Price remains below the SMA20 at 392.08 and SMA50 at 386.59, so the short-term trend has not been reclaimed.
- Reason 2: MACD is negative at -9.273 with a -4.346 histogram, which still points to bearish momentum beneath the rebound.
- Reason 3: Bollinger bands are widening and ATR is 13.26, meaning volatility is elevated and the next move could be sharp, but not yet confirmed.
- Invalidation condition: this verdict is invalidated if price falls below 355.59, because that would break the nearest support and expose the lower band at 341.74.
- Ideal entry range: 355.59 to 386.59, where support and the SMA50 frame the most relevant decision zone.
- Exit target: 392.08 to 427.76, with the SMA20 and resistance marking the first upside checkpoints.
- Stop loss protection: below 341.74, the lower Bollinger band and the next visible downside boundary.
For non-traders, this means Broadcom is bouncing, but the chart still needs proof before the move looks durable.
The latest technical reading leaves AVGO below both major moving averages as of 27 August 2026, 20:30 WIB.
Summary Data AVGO
| Last price | 368.79 USD |
| Change 1 day / 5 days / 1 month | 3.71% / 1.31% / -4.91% |
| Trend / MA-cross | sideways / none |
| SMA20 / SMA50 | 392.08 / 386.59 |
| RSI (14) / Stochastic %K | 43.5 / 26.0 |
| Bollinger %B / ATR | 27% / 13.26 |
| Support / Resistance 20 days | 355.59 / 427.76 |
| Data as of | 27 Agustus 2026 20:30 WIB |
Track AVGO stock price daily: live levels, support/resistance and our full AVGO analysis history.