Visa Golden Cross Formed: Stock Drops 1.17% (October 14, 2026)
On October 14, 2026: price 391.43 USD, trend uptrend, RSI 67.5, support 359.33, resistance 396.06. technical analysis of visa stock. Visa Golden Cross Formed —…
Trend & Price Action
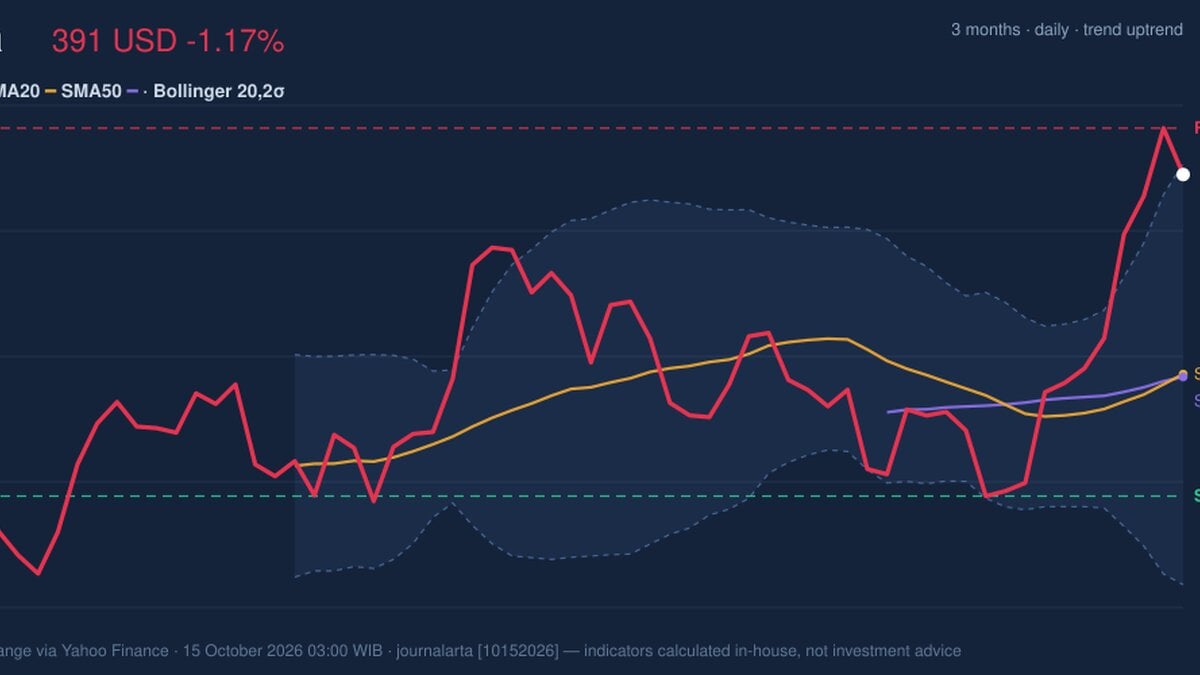
Visa remains above its 20-day moving average, or SMA20, at US$371.52, and its 50-day average at US$371.24. The SMA20 has just crossed above the SMA50—a golden cross that often signals improving trend momentum. The 20-day average is also rising, up 1.06% over five days. Together, those readings suggest the advance has a firmer technical base than a single-session move would imply. The latest decline does not yet undo that pattern. Visa has gained 5.53% over one month and 5.19% over five trading days, placing it at 87% of its 20-day range, between support at US$359.33 and resistance at US$396.06. The close sits just below that resistance and near the three-month high, so the next test is whether buyers can push through the ceiling or whether recent gains prompt a pause. The price is also near the upper Bollinger Band at US$392.53. Bollinger Bands track how far prices move from an average; a reading near the upper band can reflect strong demand, but it also means the stock has less room before running into a level where short-term pressure may emerge. The band width is 11.3%, described as normal, rather than indicating an unusually tight range poised for a sharp expansion.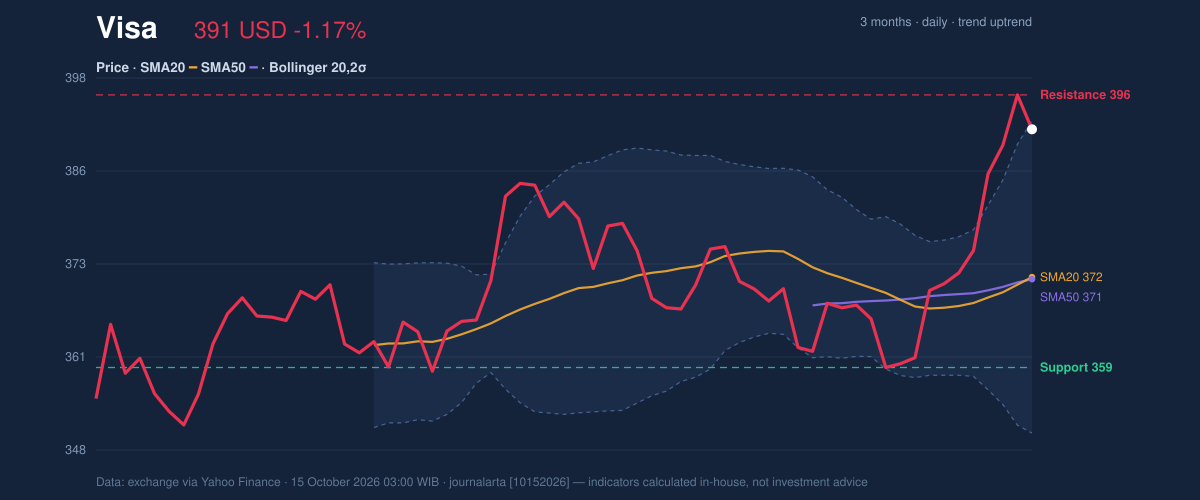
Momentum & Participation
The indicators broadly confirm the uptrend, though they are not all sending the same short-term message. The RSI is 67.5, in neutral territory, while the MACD is positive: its reading of 5.078 is above the 1.795 signal line, leaving a positive histogram of 3.283. MACD compares shorter- and longer-term price momentum; its positive spread suggests the recent advance still has underlying force. The Stochastic readings tell a more cautious story. At %K 85.8 and %D 92.6, Stochastic is overbought, meaning prices have risen quickly relative to their recent range. That is not a guarantee of a reversal, but it raises the risk that momentum could cool before the trend resumes. The difference matters: MACD supports the broader climb, while Stochastic warns that the pace may be difficult to sustain immediately.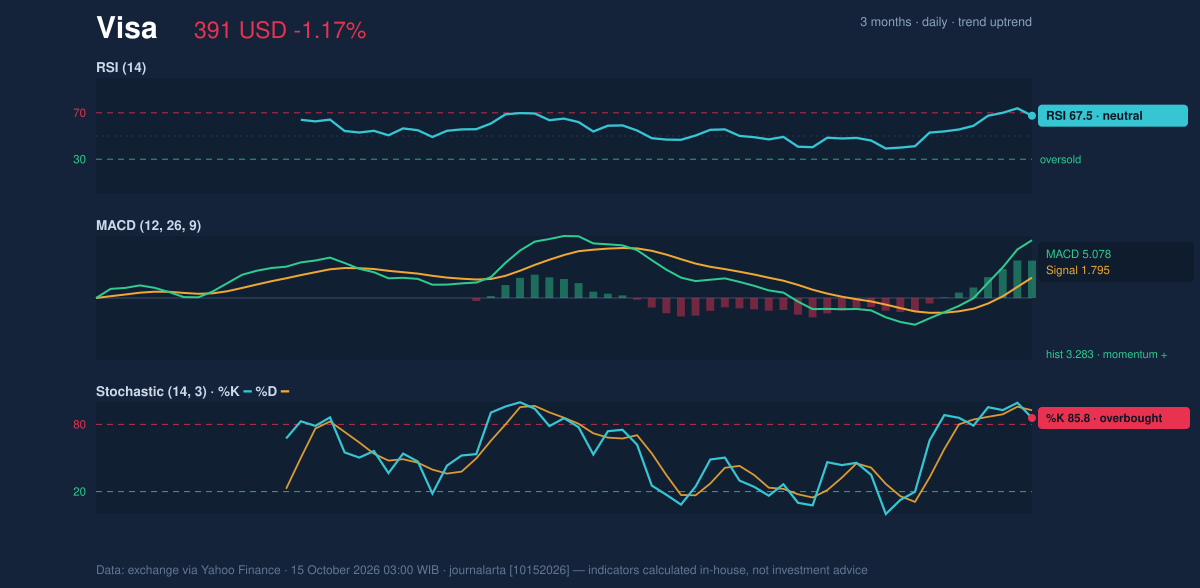
Key Levels & Scenarios
The immediate hurdle is US$396.06 resistance, near the three-month peak of US$397.19. A sustained break above that zone would strengthen the case that the current advance is extending, although the overbought Stochastic reading argues against treating a test as a confirmed breakout. If the price fails to hold its gains, the moving averages clustered near US$371.24–US$371.52 form an intermediate area to watch; the broader 20-day support is US$359.33. Average true range (ATR), which estimates typical price movement, is US$6.60, or 1.7% of the share price. That indicates moderate volatility: pullbacks and swings around nearby levels are plausible without necessarily changing the trend. A break below US$359.33 would weaken the bullish technical structure and invalidate the verdict below.Technical Verdict: HOLD (wait & see)
HOLD (wait & see) fits the mixed signals. The golden cross and rising SMA20 support the trend; positive MACD and rising OBV indicate that momentum and participation remain constructive. Against that, Stochastic is overbought and the price is close to resistance, leaving limited confirmation that the next move will be higher.- Ideal entry range: US$371.24–US$371.52, around the SMA50 and SMA20, if the price pulls back and holds that area.
- Exit target: US$396.06–US$397.19, the 20-day resistance and three-month high.
- Stop-loss protection: US$359.33, the 20-day support; the verdict is invalidated if price falls below this level.
Data
Source: Exchange data via Yahoo Finance, as of 15 October 2026, 03:00 WIB. Last price: US$391.43; previous close: US$396.06; one-day change: -1.17%; five-day change: +5.19%; one-month change: +5.53%. SMA20: US$371.52; SMA50: US$371.24; Bollinger upper/middle/lower: US$392.53/US$371.52/US$350.50; RSI: 67.5; Stochastic %K/%D: 85.8/92.6; MACD/signal/histogram: 5.078/1.795/3.283; ATR: US$6.60; volume: 7,725,400; 20-day average volume: 6,393,675; support/resistance: US$359.33/US$396.06; three-month high/low: US$397.19/US$348.50.
Why Visa is in focus today
- Trading near its 3-month high (397.19)
- Fresh golden cross: SMA20 crossed above SMA50
- Uptrend confirmed (5-day change 5.19%)
Selected automatically from 30 NYSE (US) stocks by a technical-signal score with daily weighted randomisation — not a recommendation.
Summary Data Visa
| Last price | 391.43 USD |
| Change 1 day / 5 days / 1 month | -1.17% / 5.19% / 5.53% |
| Trend / MA-cross | uptrend / golden |
| SMA20 / SMA50 | 371.52 / 371.24 |
| RSI (14) / Stochastic %K | 67.5 / 85.8 |
| Bollinger %B / ATR | 97% / 6.60 |
| Support / Resistance 20 days | 359.33 / 396.06 |
| Data as of | 15 October 2026 03:00 WIB |
Disclaimer: This technical analysis is generated automatically from exchange data (via Yahoo Finance) and indicators calculated by JournalArta, for information and education only. The verdict and the entry, target and stop-loss levels are not investment advice or a solicitation to buy or sell any security. Investment decisions and their risks rest solely with the reader.
Track Visa stock price daily: live levels, support/resistance and our full Visa analysis history.