WMT Stock Technicals: Gains 3.46% on Wednesday, Testing Key Resistance
On October 14, 2026: price 116.16 USD, trend sideways, RSI 69.1, support 103.92, resistance 116.16. technical analysis of wmt stock. WMT Stock Technicals —…
Why WMT is in focus today
- One-day move of 3.46%, about 1.7× its average daily range (ATR)
- Trading near its 3-month high (118.09)
Selected automatically from 30 NYSE (US) stocks by a technical-signal score with daily weighted randomisation — not a recommendation.
Trend & Price Action
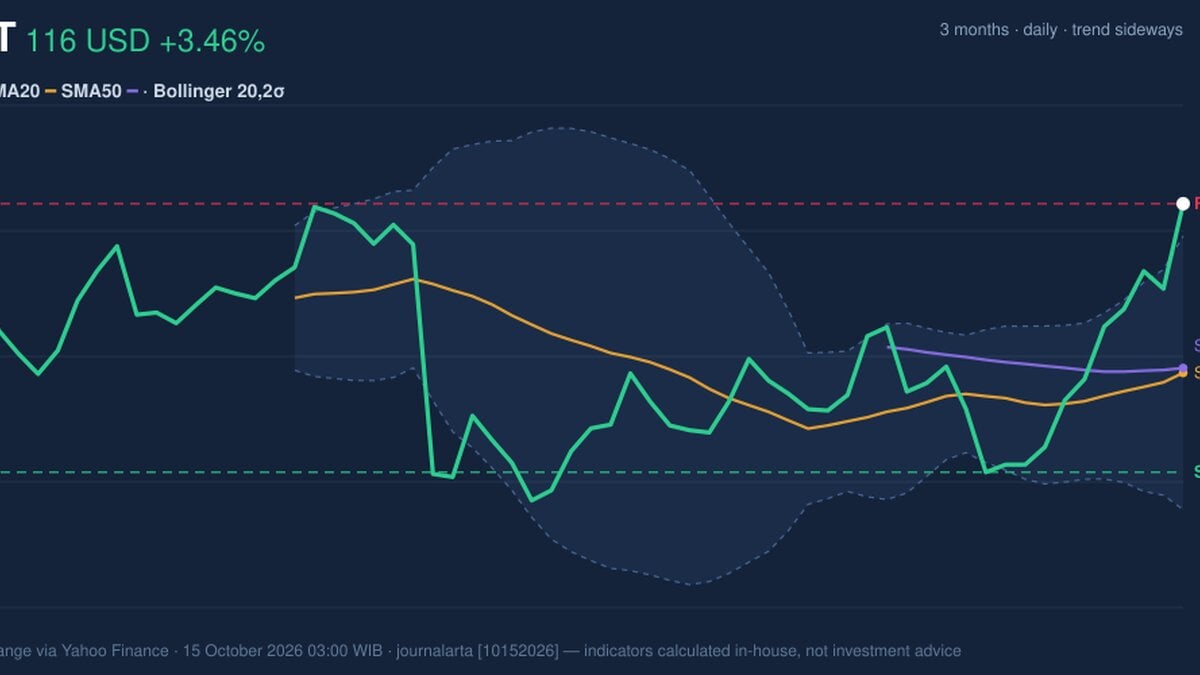
The latest close places Walmart above its 20-day simple moving average (SMA20) of $108.45, while the 50-day average is close by at $108.67. The averages have not crossed recently, so the setup does not yet show a fresh trend-change signal. The SMA20’s 1.21% rise over five trading days suggests improving short-term direction within a broader sideways trend. Walmart has gained 7.40% in five days and 8.06% in a month. It is now at the top of its 20-day range and approaching the three-month high of $118.09. That combination signals strong buying pressure, while also leaving less room before a nearby historical peak could test the rally. The close above both moving averages is constructive, but the lack of a new crossover means the longer-term trend signal remains unconfirmed.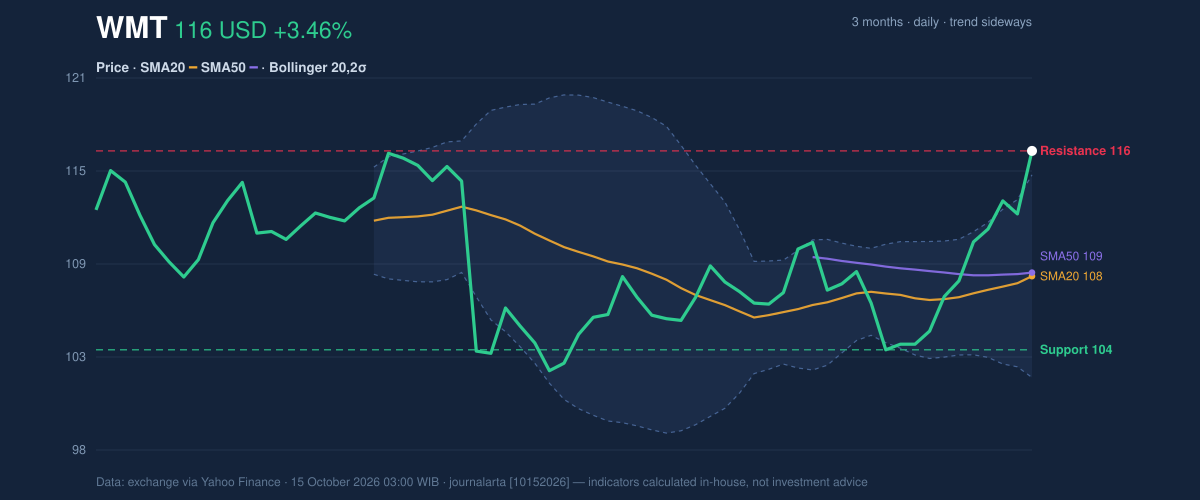
Oscillators & Momentum
Momentum indicators largely confirm the recent advance. The MACD, a measure comparing short- and longer-term price momentum, is positive at 1.311, above its 0.279 signal line; its positive 1.032 histogram indicates that upward momentum is currently dominant. The RSI is 69.1, labeled neutral in the supplied data, though close to the commonly watched overbought threshold. The Stochastic oscillator is more emphatic: %K at 99.4 and %D at 92.2 are both in overbought territory. That does not by itself mean prices must fall, but it suggests the recent climb may be vulnerable to a pause or pullback if new buying does not follow. MACD momentum is positive, while the overbought Stochastic readings warn that the move may be running hot.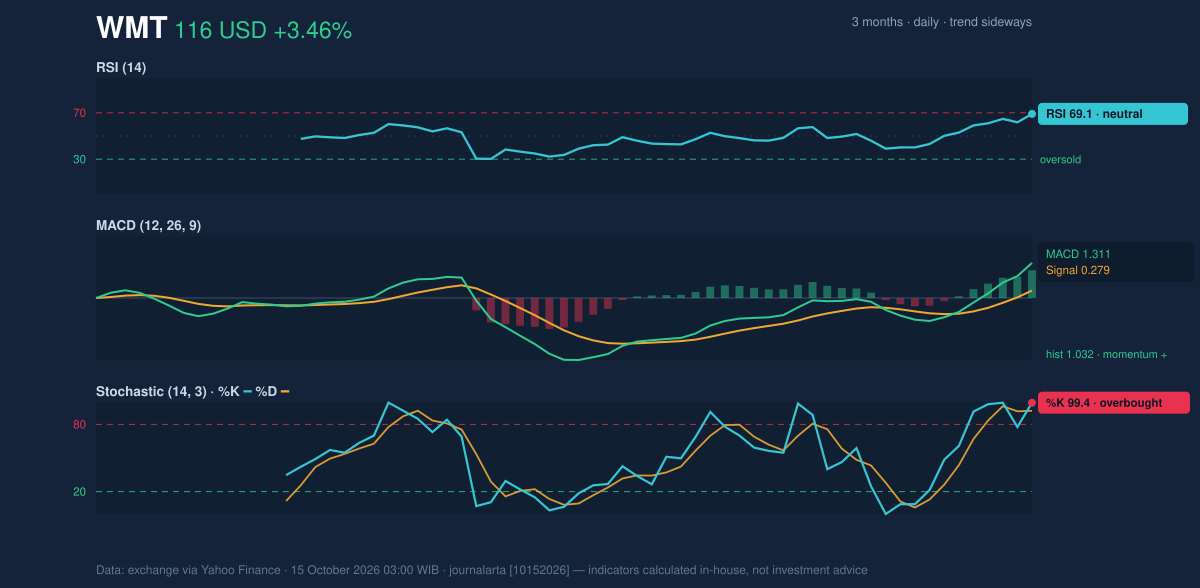
Volatility & Volume
Walmart’s close is above the upper Bollinger Band at $114.69, with %B at 112%. Bollinger Bands frame price relative to its recent average and volatility; a reading above the upper band means the stock has moved beyond that typical envelope. The band width is 11.5%, described as normal rather than unusually compressed, so the move is not emerging from a clear volatility squeeze. The 14-day ATR is $2.32, or 2.0% of the share price, indicating moderate typical price movement. Volume reached 25,839,700 shares, about 1.2 times the 20-day average, while OBV is rising. OBV tracks whether volume is accumulating on rising or falling sessions; its increase supports the view that participation is backing the advance rather than price moving on thin trading alone. Above-band trading and rising OBV show a forceful, volume-supported rally, but also raise the risk of short-term mean reversion.Key Levels & Scenarios
The nearest stated resistance is $116.16, the current price and top of the 20-day range. The three-month high at $118.09 is the next reference in the supplied data. A sustained move through that high would show the rally overcoming its nearby historical ceiling; failure to hold the current area would put the moving averages near $108.45–$108.67 back in focus. The 20-day support is $103.92, while the lower Bollinger Band sits at $102.21. These levels are materially below the latest close, so a pullback could be sizable before reaching the deeper support zone. The setup therefore pairs positive trend and volume confirmation with near-term exhaustion signals. The key test is whether price can clear the $118.09 three-month high without losing the momentum that has carried it above the upper band.Technical Verdict: HOLD (wait & see)
The technical balance supports a neutral, wait-and-see reading rather than a directional call: - Entry range: $108.45–$108.67, the SMA20–SMA50 area. - Exit target (Target Price): $118.09, the three-month high. - Stop-loss protection: $103.92, the 20-day support. - Reasons: price is above both moving averages; MACD is positive and OBV is rising; however, Stochastic is overbought and price is above the upper Bollinger Band. - Invalidation: the verdict is invalidated if price falls below $103.92. In plain English, Walmart’s momentum is strong, but the stock is stretched enough that the next move needs confirmation. | Indicator | Reading | |---|---:| | Latest price | $116.16 | | SMA20 / SMA50 | $108.45 / $108.67 | | RSI / Stochastic | 69.1 / 99.4 (%K), 92.2 (%D) | | MACD / signal / histogram | 1.311 / 0.279 / 1.032 | | Support / resistance (20-day) | $103.92 / $116.16 | | Three-month high / low | $118.09 / $102.15 |Summary Data WMT
| Last price | 116.16 USD |
| Change 1 day / 5 days / 1 month | 3.46% / 7.40% / 8.06% |
| Trend / MA-cross | sideways / none |
| SMA20 / SMA50 | 108.45 / 108.67 |
| RSI (14) / Stochastic %K | 69.1 / 99.4 |
| Bollinger %B / ATR | 112% / 2.32 |
| Support / Resistance 20 days | 103.92 / 116.16 |
| Data as of | 15 October 2026 03:00 WIB |
Disclaimer: This technical analysis is generated automatically from exchange data (via Yahoo Finance) and indicators calculated by JournalArta, for information and education only. The verdict and the entry, target and stop-loss levels are not investment advice or a solicitation to buy or sell any security. Investment decisions and their risks rest solely with the reader.
Track WMT stock price daily: live levels, support/resistance and our full WMT analysis history.