PFE Stock Technicals: Gains 2.96% on Wednesday, Testing Key Resistance
On October 14, 2026: price 29.21 USD, trend uptrend, RSI 66.5, support 27.41, resistance 29.21. technical analysis of pfe stock. PFE Stock Technicals — full…
Why PFE is in focus today
- One-day move of 2.96%, about 1.5× its average daily range (ATR)
- Closed at a 20-day high (29.21)
- Trading near its 3-month high (29.49)
- MACD histogram has just turned positive
- Breaking out of a Bollinger squeeze (band width 6.6%)
- Uptrend confirmed (5-day change 4.32%)
Selected automatically from 30 NYSE (US) stocks by a technical-signal score with daily weighted randomisation — not a recommendation.
Trend & Price Action
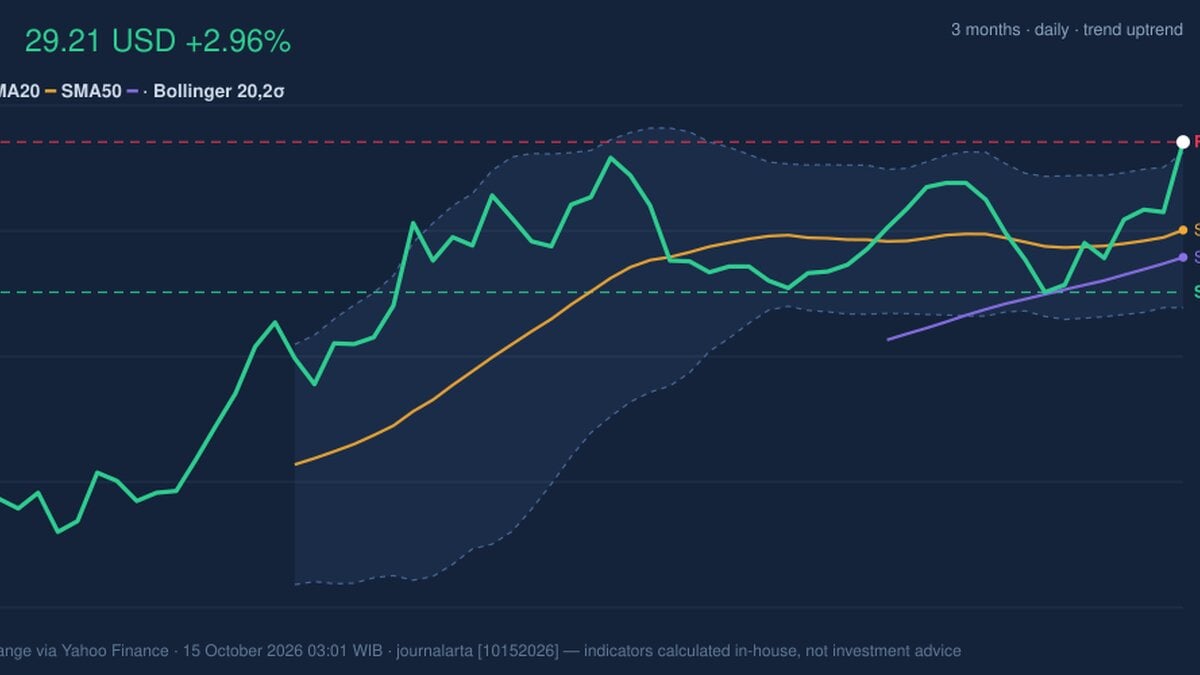
PFE has gained 4.32% over five days and 6.37% over one month. Its price is above both the 20-day simple moving average (SMA), at $28.15, and the 50-day SMA, at $27.83. The 20-day average is rising, up 0.71% over five days, supporting the near-term uptrend. There is no new moving-average crossover, so the signal comes from price holding above the averages rather than a fresh trend change. The stock closed at the top of its 20-day range and is close to its three-month peak of $29.49. That strength matters, but it also means the price has little room before testing a notable prior high. At $29.21, PFE is above its moving averages and at the upper edge of its recent trading range.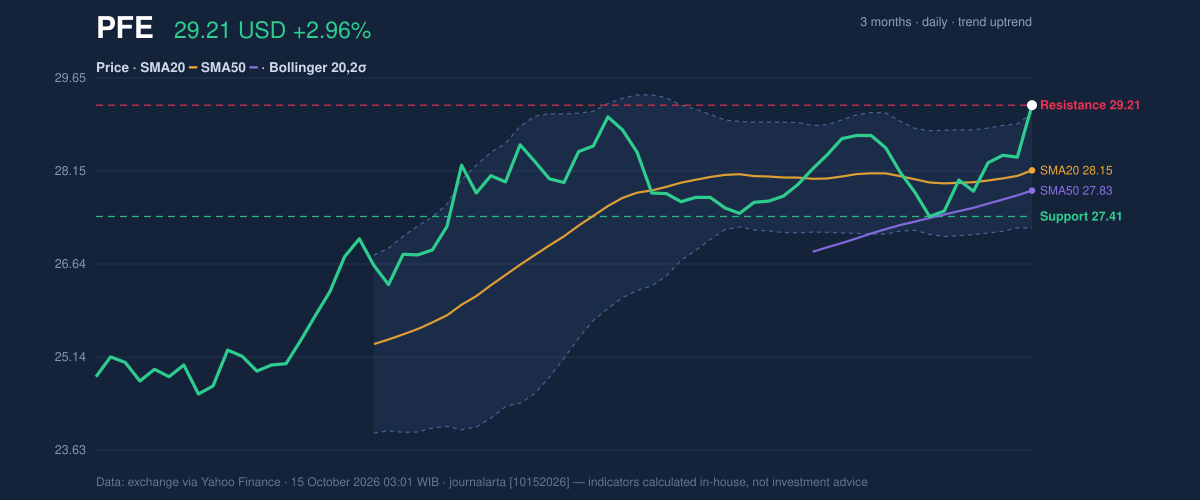
Oscillators & Momentum
The momentum picture is positive but not uniform. MACD is 0.210 against a signal line of 0.160, and its histogram has turned positive at 0.050. MACD compares short- and longer-term price momentum; a positive histogram means the faster measure is strengthening relative to its signal line. The MACD turn supports the breakout, although it does not by itself confirm how long the move can last. RSI stands at 66.5 and is labelled neutral in the supplied data. The Stochastic reading is more cautionary: %K at 88.2 and %D at 75.5 are in overbought territory. Stochastic compares a close with its recent price range, so a high reading signals that the stock is near the top of that range; it can persist during a strong trend, but also leaves less room for a near-term rise without a pause. RSI remains neutral, while overbought Stochastic readings point to stretched short-term momentum.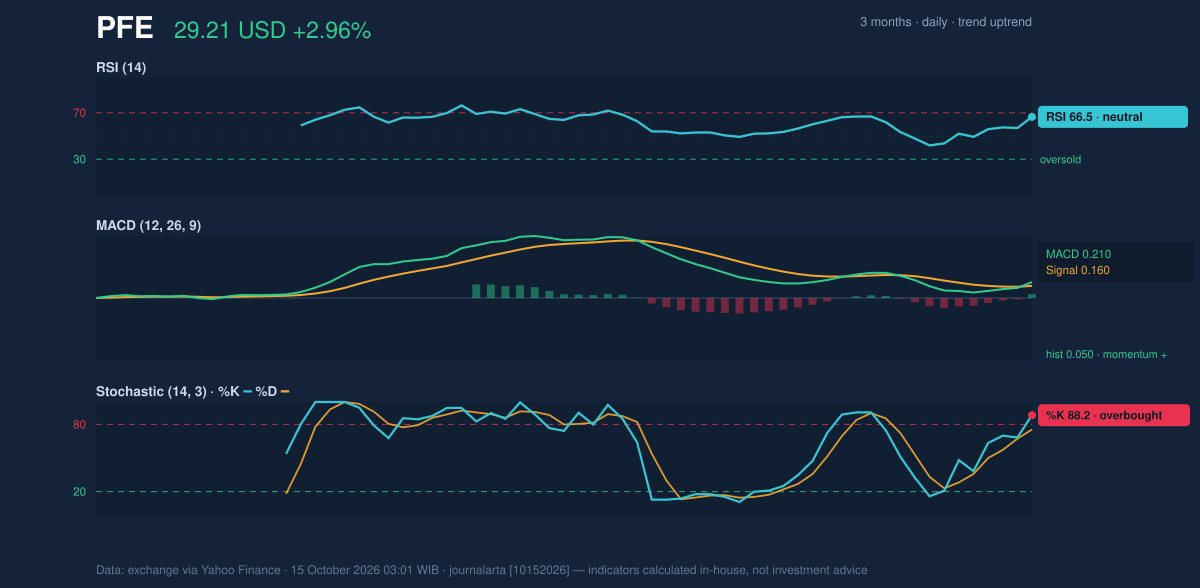
Volatility, Volume & Key Levels
Volume was 39,330,100 shares, above the 20-day average of 32,721,595. That higher participation lends weight to the day’s advance, but On-Balance Volume (OBV), which tracks whether volume is flowing more often on rising or falling sessions, is declining. The divergence means the price breakout is not fully confirmed by this volume-based measure. ATR is $0.58, or 2.0% of the price, indicating moderate day-to-day volatility. The 20-day resistance is $29.21, the current price, while the three-month high is $29.49. A sustained move above $29.21 would leave $29.49 as the next reference point in the supplied data; failure to hold the breakout would put the $28.15 SMA20 in focus. Further down, support is $27.41, above the lower Bollinger Band at $27.23. The range makes the short-term trade-off clear: price strength is established, but the stock is testing resistance with overbought Stochastic and declining OBV.Technical Verdict: HOLD (wait & see)
The indicators support a constructive trend, but not a clean confirmation of continued upside. The verdict is based on three signals:- Trend is positive: price is above rising SMA20 and above SMA50.
- MACD momentum has turned positive: its histogram is 0.050, while the narrow Bollinger Bands have expanded into a breakout signal.
- Confirmation is mixed: Stochastic is overbought and OBV is falling despite above-average volume.
- Ideal entry range: $28.15–$27.41, around the SMA20 and 20-day support.
- Exit target: $29.49, the three-month high.
- Stop-loss protection: $27.23, the lower Bollinger Band.
Summary Data PFE
| Last price | 29.21 USD |
| Change 1 day / 5 days / 1 month | 2.96% / 4.32% / 6.37% |
| Trend / MA-cross | uptrend / none |
| SMA20 / SMA50 | 28.15 / 27.83 |
| RSI (14) / Stochastic %K | 66.5 / 88.2 |
| Bollinger %B / ATR | 107% / 0.58 |
| Support / Resistance 20 days | 27.41 / 29.21 |
| Data as of | 15 October 2026 03:01 WIB |
Disclaimer: This technical analysis is generated automatically from exchange data (via Yahoo Finance) and indicators calculated by JournalArta, for information and education only. The verdict and the entry, target and stop-loss levels are not investment advice or a solicitation to buy or sell any security. Investment decisions and their risks rest solely with the reader.
Track PFE stock price daily: live levels, support/resistance and our full PFE analysis history.