JPM Stock Technicals Today: Gains 0.31%, Momentum Weakens
On Agustus 31, 2026: price 357.62 USD, trend sideways, RSI 51.4, support 351.55, resistance 365.18. technical analysis of jpm stock. JPM Stock Technicals —…
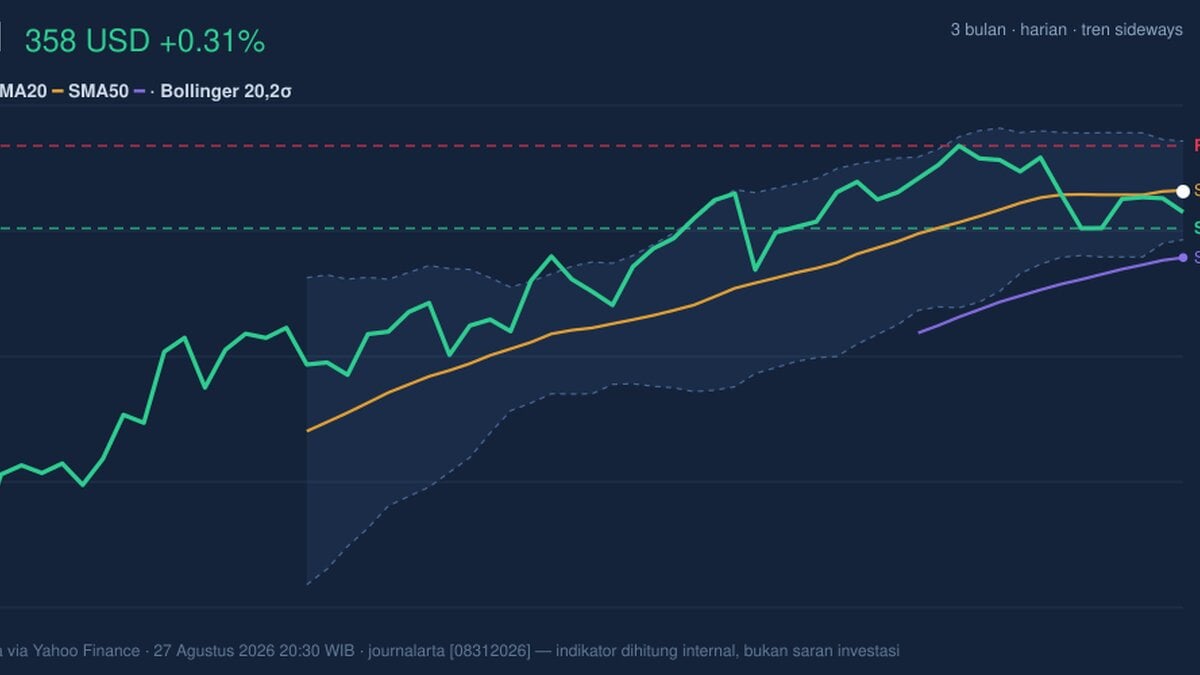
JPMorgan Chase finished at 357.62 USD on 27 August 2026, up 0.31% on the day. The move looks modest, but the tape is doing something more interesting beneath the surface: the shares are sitting just below the 20-day average at 357.82 while remaining well above the 50-day average at 346.72, a setup that points to a market that is not trending hard in either direction, but is still being supported by the longer moving average structure.
Trend & Price Action
The chart shows JPM in a sideways trend, with the 20-day slope rising only 0.18% over five days. That matters because it says the short-term trend is still alive, but only barely. Price sitting below SMA20 while staying above SMA50 usually signals a market in balance: short-term momentum has cooled, yet the broader intermediate trend has not broken down.
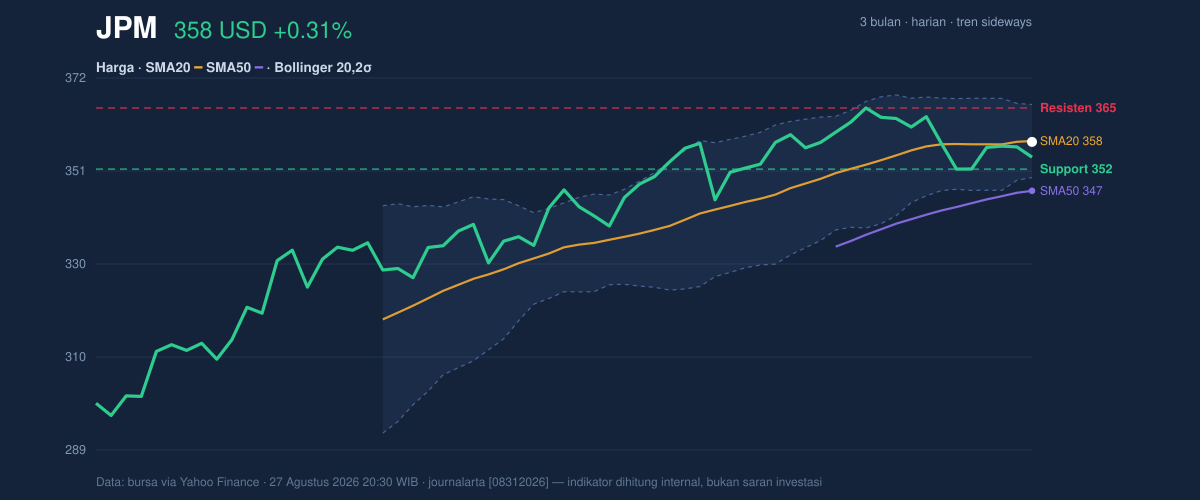
The stock is also trading at 45% of its 20-day range, which places it closer to the lower half than the upper half, but not in a stressed zone. The 20-day support at 351.55 and 20-day resistance at 365.18 frame the current consolidation. The broader 3-month high of 366.50 sits just above that resistance, so the market is effectively testing the same ceiling that has already capped upside in the recent range.
The Bollinger Bands reinforce that picture. JPM is near the middle of the band structure, with %B at 49%, meaning price is almost exactly in the center of the recent volatility envelope. The more important signal is that the band width is only 4.6% and is constricting. In plain terms, the stock is coiling. Narrow bands often precede a sharper move, but direction still needs confirmation.
Oscillators & Momentum
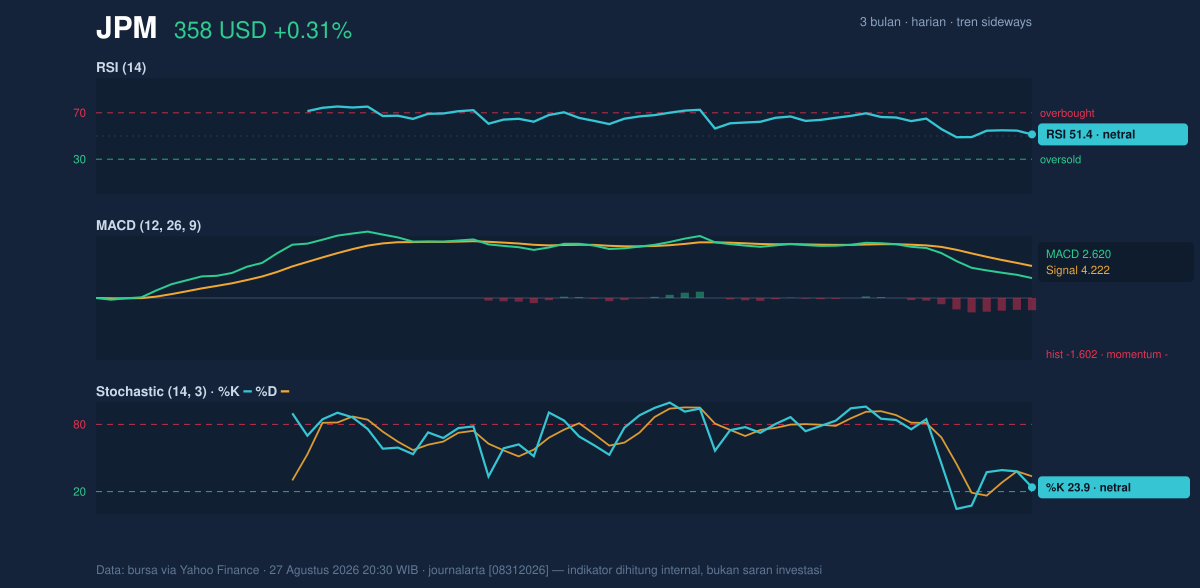
Momentum is mixed rather than decisive. The RSI at 51.4 is neutral, which tells us the stock is neither overbought nor oversold. That is important because it suggests the market is waiting for a catalyst rather than already stretched in one direction. The Stochastic %K at 23.9 and %D at 33.7 lean toward the lower end of the scale, but still sit in neutral territory. Read together, they imply recent weakness has taken some heat out of the move without pushing it into a clear oversold signal.
The more cautionary signal comes from MACD. JPM’s MACD at 2.620 is still positive in absolute terms, but it sits below the signal line at 4.222, with a histogram of -1.602. That negative histogram means short-term momentum is running behind the slower trend measure. In practical terms, the stock is not breaking down, but upside acceleration has faded. The moving-average structure is still constructive, yet momentum is no longer confirming it.
Volatility & Volume
Volatility is subdued. The ATR(14) at 5.14, equal to 1.4% of price, indicates relatively low daily movement for now. Combined with the Bollinger squeeze, that points to a market that may be storing energy rather than releasing it. Low ATR does not predict direction, but it does suggest that once price leaves the current band, it could travel more cleanly than it has been doing lately.
Volume, however, is not providing strong confirmation. Last session volume was 5,209,900, below the 20-day average of 5,685,980, or about 0.9× normal. That is a sign of limited conviction behind the latest move. In chart terms, a price advance on lighter volume is less persuasive than one backed by rising participation. The OBV is falling, which means cumulative volume flow has been weakening even as price has held near the middle of its range. That divergence matters: it suggests buyers have not yet regained clear control.
Key Levels & Scenarios
The immediate technical map is straightforward. Support at 351.55 is the first level to watch if the stock loses its current equilibrium. A break below that area would put pressure on the short-term consolidation and could shift attention toward the lower Bollinger band at 349.66. On the upside, resistance at 365.18 is the first hurdle, with the 3-month high at 366.50 just above it. That cluster is important because it marks the edge of the recent ceiling.
The current structure says JPM is not in a breakout, but it is also not in a breakdown. Price is parked between support and resistance, the moving averages remain intact, and volatility is compressing. The missing piece is confirmation: either a stronger push through resistance with volume, or a loss of support that would expose the lower band and weaken the intermediate trend.
Technical Verdict: HOLD (wait & see)
HOLD (wait & see)
- MACD is still positive, but the histogram is negative, showing momentum is lagging the trend.
- RSI at 51.4 and Stochastic at 23.9 / 33.7 are neutral, which does not yet support a clean directional move.
- Bollinger Bands are squeezing and ATR is low, so the stock may be preparing for a move, but the direction is not confirmed.
- Verdict invalidated if price falls below 351.55, which would weaken the current support structure.
- Ideal Entry Range: 351.55 to 357.82
- Exit Target: 365.18 to 366.50
- Stop Loss protection: below 349.66
In plain English: JPM is still holding its trend, but the chart says the next meaningful move has not shown itself yet.
Volume last session: 5,209,900 versus a 20-day average of 5,685,980.
Summary Data JPM
| Last price | 357.62 USD |
| Change 1 day / 5 days / 1 month | 0.31% / 1.73% / 1.93% |
| Trend / MA-cross | sideways / none |
| SMA20 / SMA50 | 357.82 / 346.72 |
| RSI (14) / Stochastic %K | 51.4 / 23.9 |
| Bollinger %B / ATR | 49% / 5.14 |
| Support / Resistance 20 days | 351.55 / 365.18 |
| Data as of | 27 Agustus 2026 20:30 WIB |
Track JPM stock price daily: live levels, support/resistance and our full JPM analysis history.