NKE Stock Technicals Today: Gains 2.62%, Momentum Weakens
On Agustus 31, 2026: price 39.60 USD, trend downtrend, RSI 36.4, support 38.44, resistance 42.64. technical analysis of nke stock. NKE Stock Technicals — full…
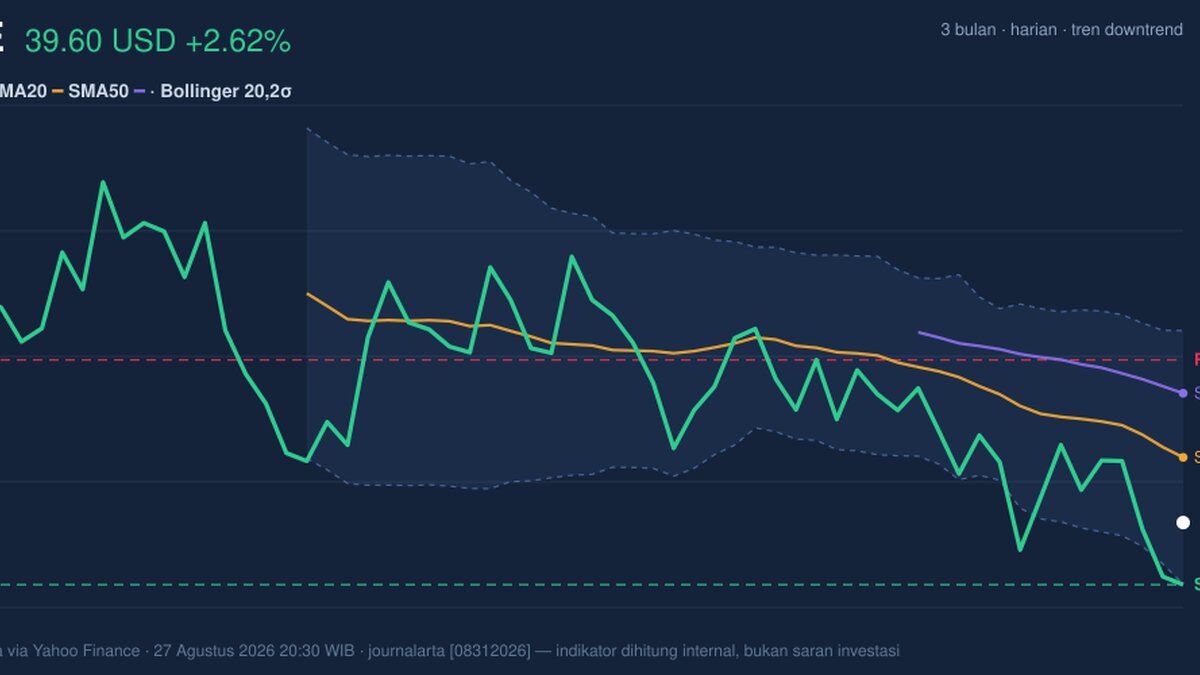
Nike shares moved to 39.60 USD on the NYSE, up 2.62% from the previous close of 38.59, but the bounce sits inside a broader slide: the stock is still down 1.52% over 5 days and 6.36% over 1 month, according to Yahoo Finance data as of 27 August 2026 20:30 WIB. The message from the chart is not simply that Nike rose; it is that the latest gain arrived while the stock remained below its short-term trend line, with sellers still controlling the bigger picture.
Trend & Price Action
The most important signal is where the price sits relative to trend markers. Nike is in a downtrend, with the SMA20 at 40.82 and the SMA50 at 42.02, while the share price remains below the SMA20. That matters because moving averages are not just lines on a chart; they show the average trading cost over recent periods. When price is below both the 20-day and 50-day averages, rallies often behave like recovery attempts rather than confirmed reversals.
The slope of the SMA20 at -1.73% over 5 days reinforces that pressure. A falling short-term average means recent prices have been drifting lower fast enough to pull the trend line down with them. There is also no fresh MA-cross, so the chart has not produced the kind of crossover that would usually signal a more durable shift in direction. As shown in the chart, the current move is still working against overhead trend resistance.
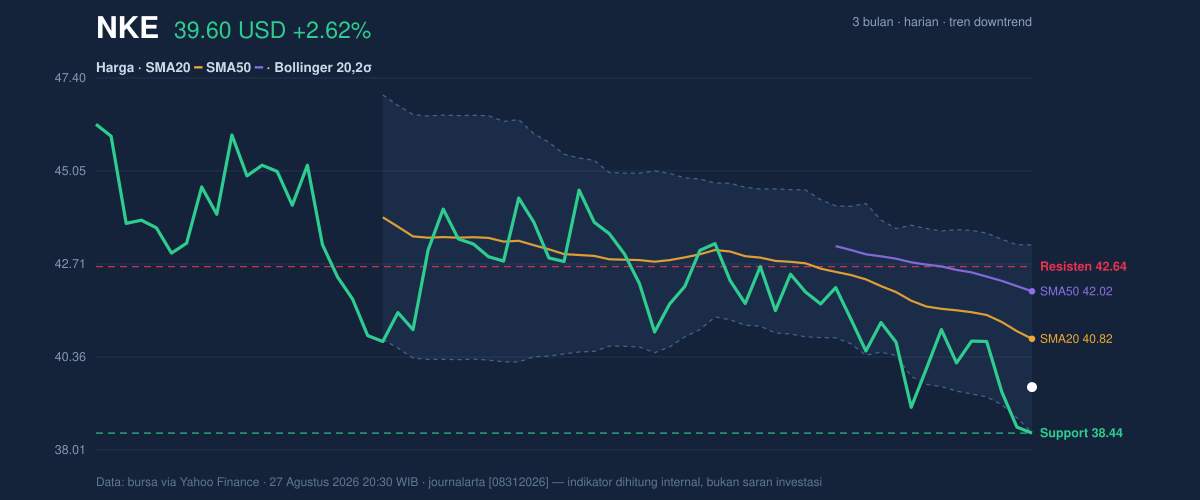
Price is also only 28% of the way up its recent range, with support at 38.44 and resistance at 42.64. That positioning says the market is closer to the lower end of the corridor than the upper end. The stock is not collapsing, but it is not yet reclaiming enough ground to suggest buyers have taken back control.
Short line: the bounce is real, but the trend is still leaning down.
Oscillators & Momentum
Momentum indicators paint a mixed but still cautious picture. The RSI at 36.4 is described as neutral, which means Nike is neither deeply overbought nor deeply oversold on that measure. In plain English, RSI is a gauge of how stretched a move has become; a reading in the mid-30s says the stock has weakened, but not to the kind of extreme that automatically forces a rebound.
The more striking signal comes from the Stochastic %K at 6.7 and %D at 9.2, which is oversold. Stochastic focuses on where the price is closing within its recent range, so such low readings suggest the stock has been pinned near the bottom of that range. That can sometimes precede a bounce, but only if price starts to lift back above nearby resistance. Without that follow-through, oversold can simply mean “weak for a while.”
The MACD at -0.901, below the signal line at -0.720, with a histogram of -0.181, keeps the momentum verdict negative. MACD is a trend-following momentum indicator, and when it sits below its signal line, it shows downside force is still dominating. The histogram being negative means that gap has not yet turned in buyers’ favor.
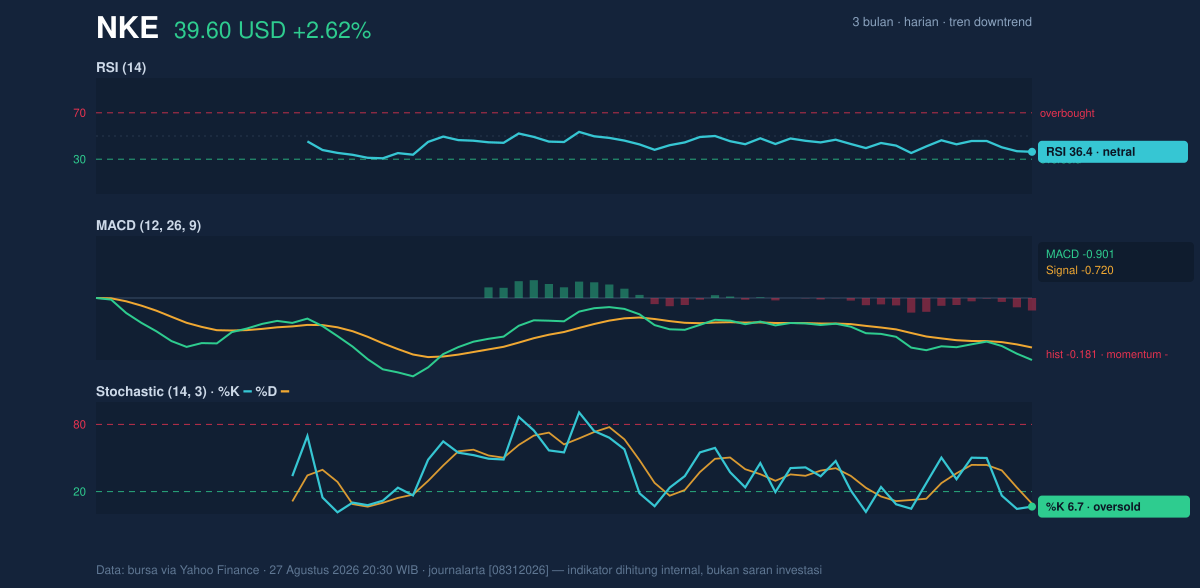
So the setup is uneven: oversold stochastic readings hint at exhaustion, but MACD still says the down move has not fully lost its grip.
Volatility & Volume
Volatility is present, but not extreme. Nike’s ATR at 1.13, equal to 2.8% of price, points to moderate volatility. ATR, or average true range, measures how much the stock typically moves in a day. A reading like this suggests price can travel enough to matter, but not so wildly that the chart has become disorderly.
Bollinger Bands add a useful layer. The stock is trading with %B at 24%, meaning it sits closer to the lower band than the middle of the channel. With the lower band at 38.45, the share price is hovering just above a technical floor that often attracts attention from short-term traders. The band width at 11.6% is normal, not a squeeze. That matters because a squeeze can warn of an imminent burst of movement; here, the chart is not yet showing that kind of compression. Instead, the market looks like it is moving within an ordinary volatility envelope, with downside pressure still visible.
Volume confirms that the latest move had participation. The most recent volume was 36,573,800, or 1.3× normal versus the 20-hour average of 27,204,085. High volume on a downtrend can mean more than just activity; it often signals conviction. Yet OBV is falling, which means the broader balance of volume has been favoring sellers. In other words, the latest bounce came with interest, but the underlying accumulation pattern has not turned positive.
Key Levels & Scenarios
The immediate technical map is fairly clear. Support at 38.44 sits just above the 3-month low of 38.17, so this area is critical: a break there would expose the chart to fresh downside pressure and would likely confirm that the recent floor has failed. On the upside, resistance at 42.64 is the first barrier, followed by the SMA50 at 42.02 and the Bollinger upper band at 43.19. That cluster matters because it is where a rebound would need to prove itself.
If the stock can reclaim the SMA20 at 40.82 and then push through 42.64, the chart would begin to look less like a dead-cat bounce and more like a repair attempt. If it slips back under 38.44, the tone changes quickly: the market would be signaling that buyers could not defend the lower band and recent support.
Technical Verdict: HOLD (wait & see)
HOLD (wait & see)
- The stock is still in a downtrend and remains below the SMA20 at 40.82 and SMA50 at 42.02.
- MACD remains negative, showing downside momentum is still in place even after the bounce.
- Stochastic is oversold, which supports the idea of a rebound attempt, but not yet a confirmed reversal.
Verdict invalidated if price falls below 38.44.
- Ideal Entry Range: 38.44 to 40.82
- Exit Target: 42.64 to 43.19
- Stop Loss protection: below 38.17
For non-traders, this means Nike is showing signs of a bounce, but the chart still needs proof that the downtrend has really stopped. “It’s trying to turn, but it hasn’t earned that trust yet.”
Summary Data NKE
| Last price | 39.60 USD |
| Change 1 day / 5 days / 1 month | 2.62% / -1.52% / -6.36% |
| Trend / MA-cross | downtrend / none |
| SMA20 / SMA50 | 40.82 / 42.02 |
| RSI (14) / Stochastic %K | 36.4 / 6.7 |
| Bollinger %B / ATR | 24% / 1.13 |
| Support / Resistance 20 days | 38.44 / 42.64 |
| Data as of | 27 Agustus 2026 20:30 WIB |
Track NKE stock price daily: live levels, support/resistance and our full NKE analysis history.