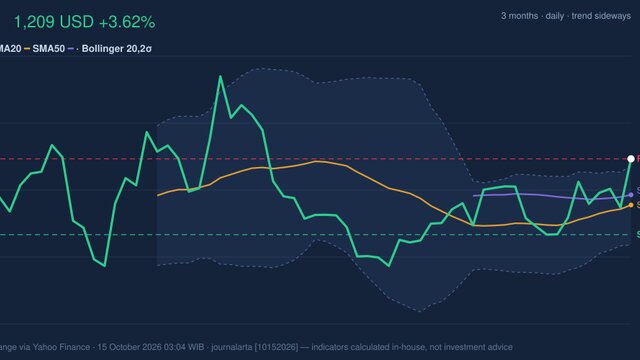
NVDA Stock Gains 3.76%, Momentum Weakens In Focus
On Agustus 31, 2026: price 217.55 USD, trend uptrend, RSI 61.2, support 200.75, resistance 227.98. technical analysis of nvda stock. NVDA Stock Gains — full…
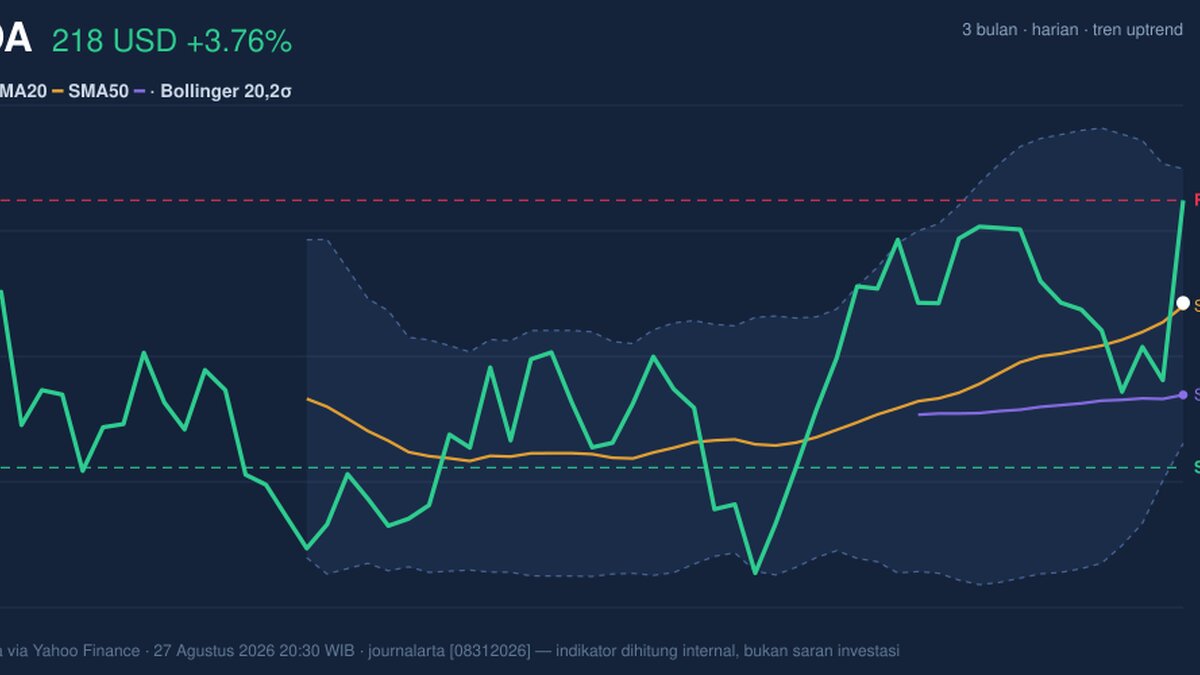
Nvidia rose on the NASDAQ to 217.55 USD on 27 August 2026, up 3.76% from the previous close, with the move keeping the stock just above its short-term trend line. The number matters because it shows buyers still defending the recent advance, but the chart also shows that momentum is not moving in a straight line.
Trend & Price Action
As shown in the chart, Nvidia is trading above its SMA20 at 217.21 and well above its SMA50 at 208.16, which keeps the broader short-term structure in an uptrend. The SMA20 slope of 2.08% over 5 days signals that the average price itself is still rising, a useful sign because it means the trend is being carried forward by recent closes rather than just a single gap higher.
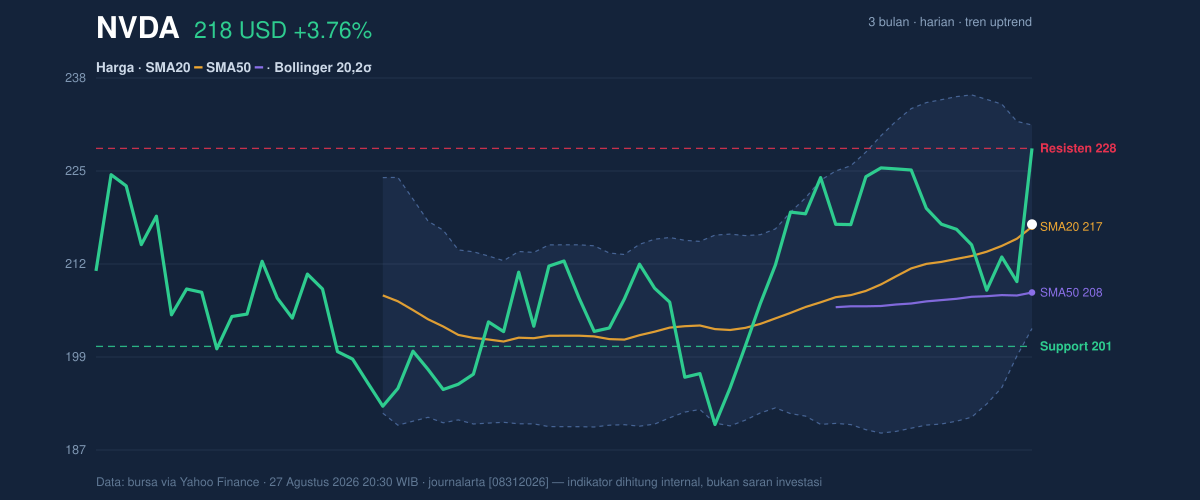
The stock is sitting at 62% of its 20-hour range, so it is not pressing the top of the band but is also clearly not near the lower end where bargain-hunting usually becomes more obvious. That placement matters: it suggests the market has recovered a good part of the recent range, yet there is still room for either continuation or a pause before the next push. The 20-hour support at 200.75 and 20-hour resistance at 227.98 define the current battlefield, while the 3-month high at 232.28 sits just above that resistance and acts as the next obvious ceiling.
Oscillators & Momentum
The momentum picture is mixed, and that is the main signal in the chart. RSI at 61.2 is still neutral, which means the stock is not yet stretched enough to scream exhaustion. But the Stochastic %K at 89.3 versus %D at 43.0 is overbought, a sign that the latest price burst has moved ahead of the slower trend-following line. In plain English: the stock has climbed quickly enough that short-term traders may already be crowded in.
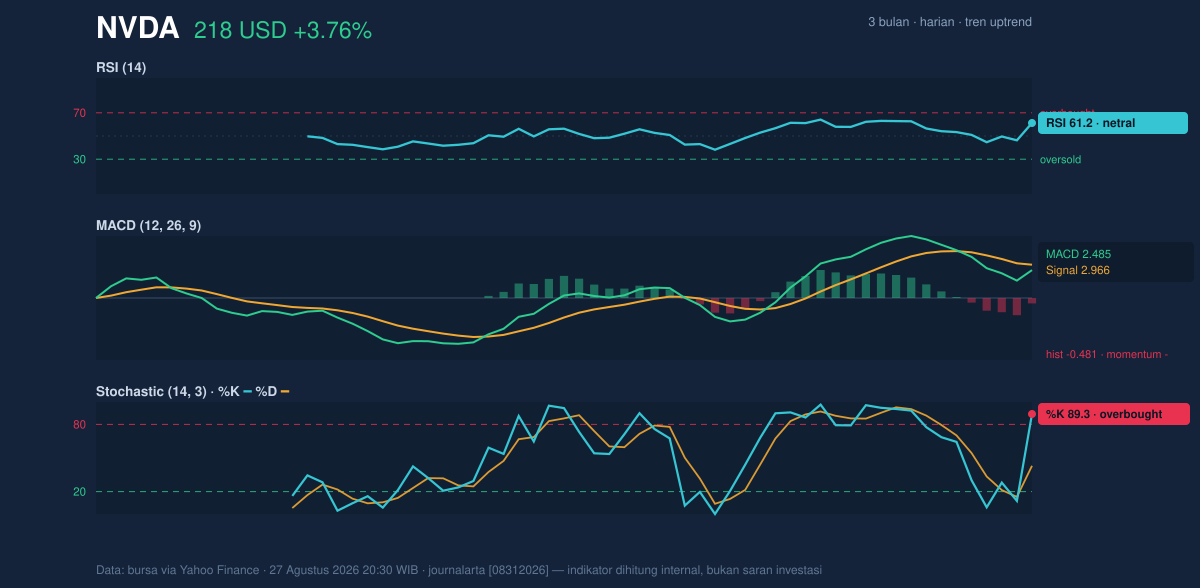
The MACD at 2.485 remains above zero, but it is below its signal at 2.966, and the histogram at -0.481 shows negative momentum. That combination is important because it says the trend is still positive on the surface, yet the rate of ascent has cooled. When MACD slips under its signal while price is still above the moving averages, it often points to a market that is pausing rather than reversing outright — but it also warns that fresh upside may need stronger follow-through to keep extending.
Volatility & Volume
Bollinger Bands give the move more context. Nvidia’s %B at 51% places the stock near the middle of the band structure, and the 12.9% band width is described as normal. That matters because it suggests the stock is not in a volatility squeeze that often precedes a sharp breakout, nor is it in an unusually wide, panic-like expansion. The upper band at 231.20 is the near-term marker for a stronger breakout attempt, while the lower band at 203.21 is the area where the trend would start looking more fragile.
Volatility is also supported by the ATR(14) at 6.51, or 3.0% of price, which points to moderate volatility. In practical terms, that means daily swings are still large enough to matter, but not so extreme that the stock appears disorderly.
Volume, however, sends a more cautionary message. The latest 298,909,800 shares traded versus a 20-hour average of 125,138,775 is a 2.4× jump, which confirms that the move had real participation rather than being a thin, low-liquidity drift. Yet OBV is down, and that divergence matters because on-balance volume is designed to show whether money is steadily accumulating. Falling OBV while price rises can mean the latest advance is not being broadly supported, leaving the rally more exposed if buyers step back.
Key Levels & Scenarios
The key technical map is straightforward. 217.21 is both the SMA20 and the Bollinger middle band, so it is the first line that tells you whether the stock is holding its short-term base. A sustained move above 227.98 would put the market back into direct contact with the 231.20 upper band and then the 232.28 3-month high. Failure to hold the 203.21 lower band would be a stronger warning that the recent advance is losing shape.
The cleanest reading is that Nvidia is still in an uptrend, but the climb is running into internal fatigue. Price is above trend, volume is strong, and the recent range is being held, yet Stochastic is overbought, MACD momentum is negative, and OBV is falling. That mix usually means the market has not broken down, but it may need consolidation before it can credibly challenge the upper boundary.
Technical Verdict: HOLD (wait & see)
HOLD (wait & see)
- Reason 1: Price remains above SMA20 at 217.21 and SMA50 at 208.16, so the trend is still constructive.
- Reason 2: Stochastic is overbought and MACD histogram is negative, which signals fading short-term momentum.
- Reason 3: Volume jumped 2.4×, but OBV is down, so participation is not fully confirming the advance.
- Verdict invalidated if price breaks below 203.21, the lower Bollinger band, because that would suggest the short-term structure is weakening more than expected.
- Ideal Entry Range: 217.21 to 203.21
- Exit Target: 227.98 to 231.20
- Stop Loss protection: below 203.21
For non-traders: Nvidia is still trending up, but the chart says the latest rise is losing some energy.
The 3-month high is 232.28 USD.
Summary Data NVDA
| Last price | 217.55 USD |
| Change 1 day / 5 days / 1 month | 3.76% / 0.32% / 11.54% |
| Trend / MA-cross | uptrend / none |
| SMA20 / SMA50 | 217.21 / 208.16 |
| RSI (14) / Stochastic %K | 61.2 / 89.3 |
| Bollinger %B / ATR | 51% / 6.51 |
| Support / Resistance 20 days | 200.75 / 227.98 |
| Data as of | 27 Agustus 2026 20:30 WIB |
Track NVDA stock price daily: live levels, support/resistance and our full NVDA analysis history.