PANW Stock Technicals Today: Gains 9.51%, Momentum Weakens
On Agustus 31, 2026: price 371.59 USD, trend uptrend, RSI 60.2, support 331.83, resistance 396.00. technical analysis of panw stock. PANW Stock Technicals —…
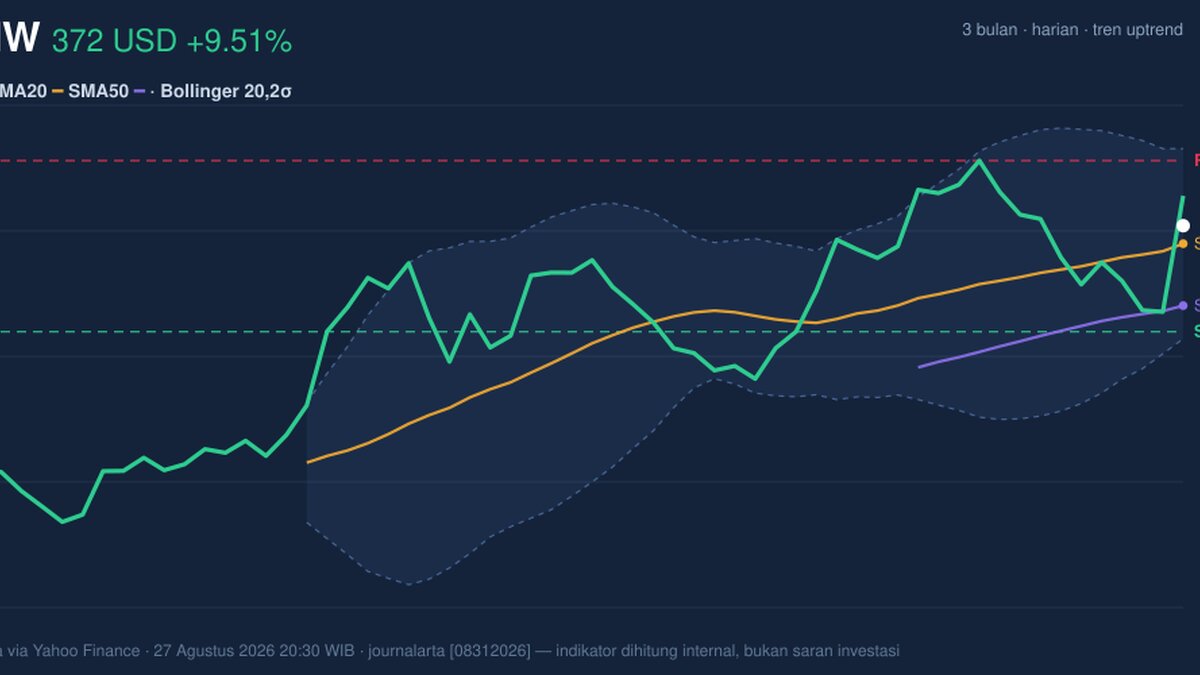
Palo Alto Networks rose to 371.59 USD on NASDAQ, up 9.51% from the previous close of 339.31 USD, and the move matters because it pushed the stock back above its short-term trend line even as momentum signals remain mixed. The shares are now trading above the SMA20 at 364.87 and well above the SMA50 at 341.63, which tells the market is still treating recent pullbacks as buying opportunities. But the chart is not giving a clean all-clear: the rally has reached a zone where price strength is real, yet follow-through is still being tested.
Trend & Price Action
The price structure remains constructive. The stock is in an uptrend, with the SMA20 rising 2.40% over 5 days, a sign that the short-term average is still climbing rather than flattening out. That matters because a rising SMA20 usually means recent buyers are willing to pay up, and the current price sitting above it suggests the trend has not broken.
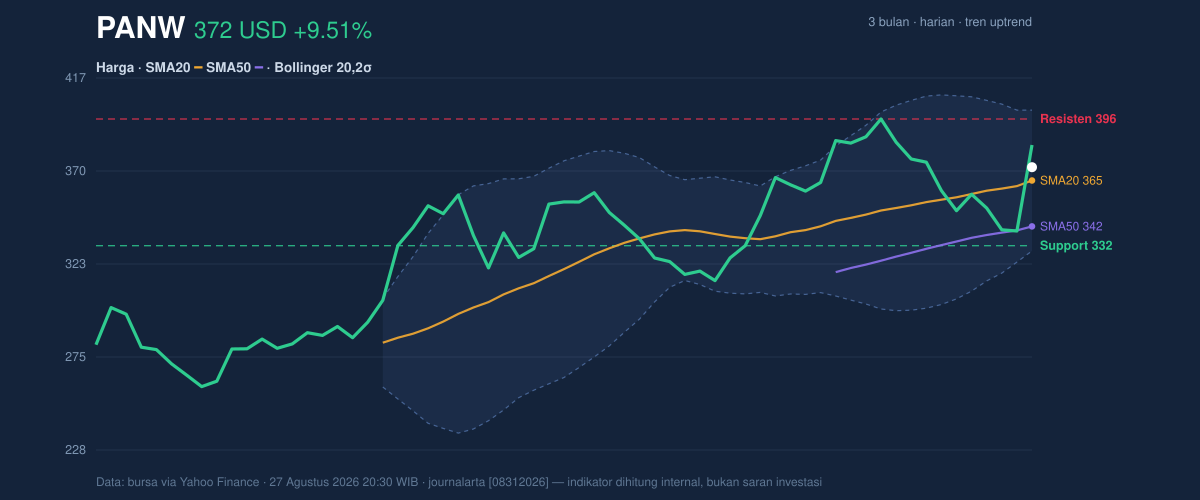
As shown in the chart, PANW is also trading at about 62% of its 20-day range, between 331.83 support and 396.00 resistance. That placement is important: it means the stock is closer to the upper half of its recent band, but not yet pressing the ceiling. The 3-month high of 398.88 is close enough to act as a psychological reference point, while the 3-month low of 251.15 shows how far the stock has already recovered from deeper weakness.
The Bollinger Bands help frame the move. Price is above the middle band at 364.87, with the upper band at 400.52 and the lower band at 329.23. The %B at 59% says the stock is in the upper half of its band, but not stretched to the extreme. The 19.5% band width is normal, which suggests the market is not in a compression phase that often precedes a sharp breakout. In plain terms, the stock has room to move, but it is not coiled for a dramatic volatility release right now.
Oscillators & Momentum
Momentum is where the picture becomes more nuanced. The RSI at 60.2 is neutral-to-firm, which usually means the stock has positive momentum without being overbought. That is a healthy reading in isolation. The Stochastic %K at 77.4 versus %D at 33.4 is more aggressive, showing the short-term price has moved faster than its recent average. That can support continuation, but it can also warn that the rally is becoming extended on a very short horizon.
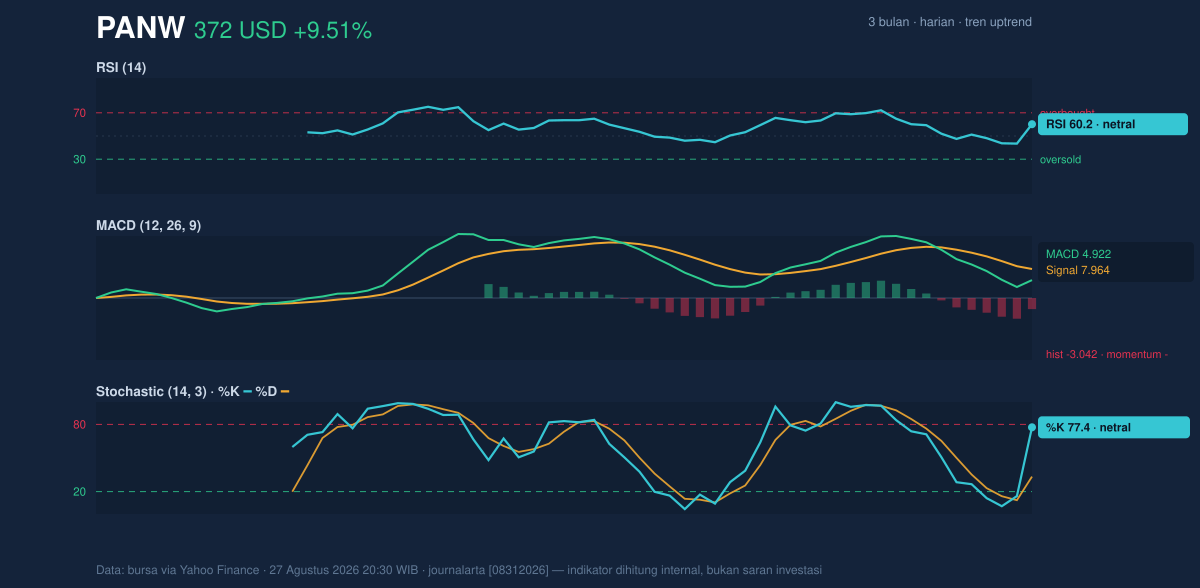
The more cautionary signal comes from MACD. The MACD at 4.922 is still positive in absolute terms, but it sits below the signal line at 7.964, leaving a histogram of -3.042. That combination means upside momentum is not currently leading price; the trend is still up, but the acceleration behind it has weakened. In practical terms, buyers are still in control of the broader structure, yet the latest leg higher has lost some force.
That divergence between a rising price and a softer MACD is worth watching. It does not negate the trend, but it does explain why the stock may need a pause or consolidation before it can challenge the next resistance zone cleanly.
Volatility & Volume
Volatility is elevated. The ATR(14) at 17.53 equals 4.7% of price, which means daily swings are still large enough to matter. For readers, ATR is a measure of how much the stock typically moves in a day; when it is high, stops can be hit quickly and price can travel farther in either direction.
Volume supports the idea that this move has participation behind it, but not full conviction. Last volume was 7,308,800, about 1.3× the 20-day average of 5,510,655. That is enough to say the rally was not thin or purely mechanical. Yet the OBV is down, and that is the key caution. OBV, or on-balance volume, tracks whether volume is flowing into the stock or out of it over time. A falling OBV while price rises can mean the advance is not being broadly confirmed by accumulation. In other words, the market is buying the headline move, but not necessarily building a stronger base underneath it.
Key Levels & Scenarios
The immediate map is clear. Support at 331.83 is the first important floor, and it lines up closely with the lower Bollinger Band at 329.23. That overlap makes the low-330s a meaningful area where the market has previously shown willingness to defend the stock. On the upside, resistance at 396.00 sits just below the 400.52 upper Bollinger Band and near the 3-month high of 398.88, creating a tight cluster of overhead supply.
If PANW can keep holding above the 364.87 SMA20, the chart remains biased toward a retest of the 396.00 area. If it fails to hold the low-360s and slips back through the mid-band, the market would likely start treating the recent surge as a short-term rebound rather than a sustained breakout attempt. The current setup is therefore less about chasing strength and more about whether the stock can absorb the recent gain without giving back the trend support it just reclaimed.
Technical Verdict: HOLD (wait & see)
HOLD (wait & see)
- Price above SMA20 and SMA50 keeps the broader structure constructive, with the SMA20 rising 2.40% over 5 days.
- RSI at 60.2 is supportive but not stretched; however, MACD below signal with a -3.042 histogram shows momentum is not fully confirming the price jump.
- Volume at 1.3× normal supports participation, but the downward OBV argues the move is not yet fully validated by accumulation.
- Invalidation condition: verdict is invalidated if price falls below 331.83, the key 20-hour support.
- Ideal Entry Range: 364.87 to 371.59
- Exit Target: 396.00
- Stop Loss protection: 331.83
For non-traders, this means the stock looks stronger than it did a few sessions ago, but the chart still needs proof that the rally has real staying power.
“The next move matters more than the last one.”
Summary Data PANW
| Last price | 371.59 USD |
| Change 1 day / 5 days / 1 month | 9.51% / 6.30% / 14.10% |
| Trend / MA-cross | uptrend / none |
| SMA20 / SMA50 | 364.87 / 341.63 |
| RSI (14) / Stochastic %K | 60.2 / 77.4 |
| Bollinger %B / ATR | 59% / 17.53 |
| Support / Resistance 20 days | 331.83 / 396.00 |
| Data as of | 27 Agustus 2026 20:30 WIB |
Track PANW stock price daily: live levels, support/resistance and our full PANW analysis history.