RSI Overbought, CRM Stock Gains 24.50% Today
On Agustus 31, 2026: price 256.00 USD, trend uptrend, RSI 79.6, support 184.02, resistance 252.05. technical analysis of crm stock. RSI Overbought — full…
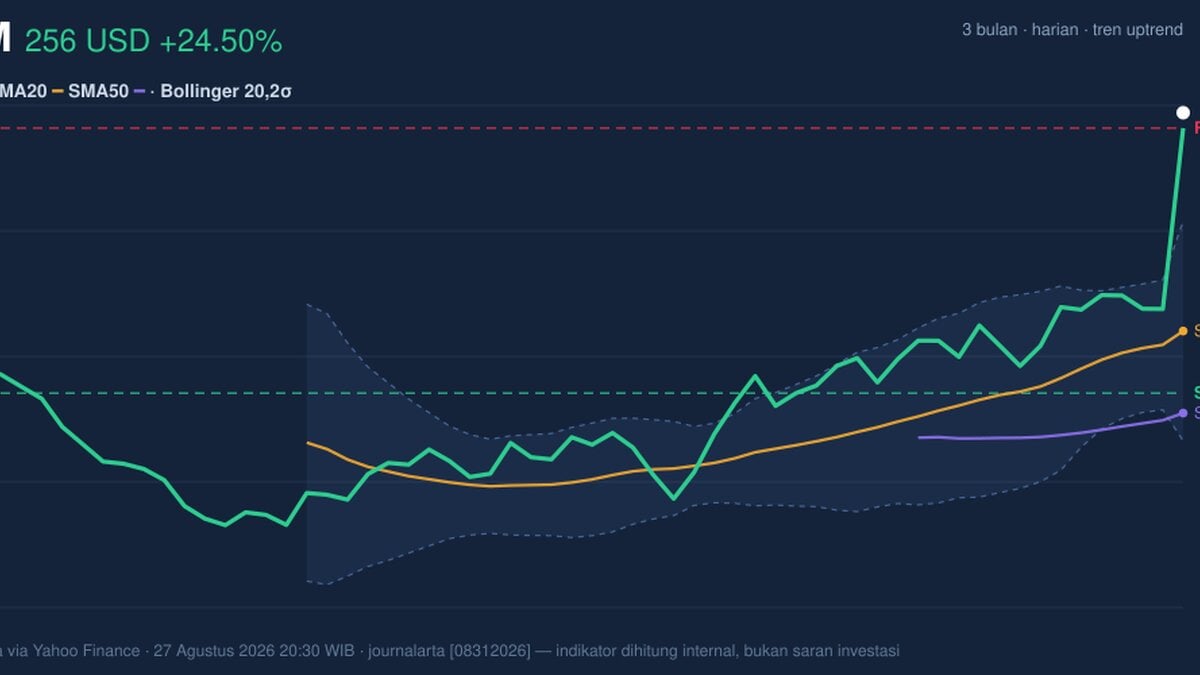
Salesforce Inc. climbed to 256.00 USD on the NYSE, a move that pushed the stock above its recent trading range and into fresh territory relative to its 3-month high of 254.48 USD. The advance was not just a one-day pop: the shares are up 24.50% in one day, 24.62% in five days and 41.66% over one month, a sequence that signals a market rapidly re-pricing the company’s earnings and growth narrative. One very short read: the stock is stretched.
Trend & Price Action
The chart shows CRM trading well above both its SMA20 at 199.98 and SMA50 at 178.87, a classic sign that short-term buyers have taken control and that the medium-term trend is still pointing higher. The uptrend is being reinforced by the SMA20 slope of 5.09% over 5 days, which means the recent average price itself is rising quickly, not merely being pulled up by one dramatic session.
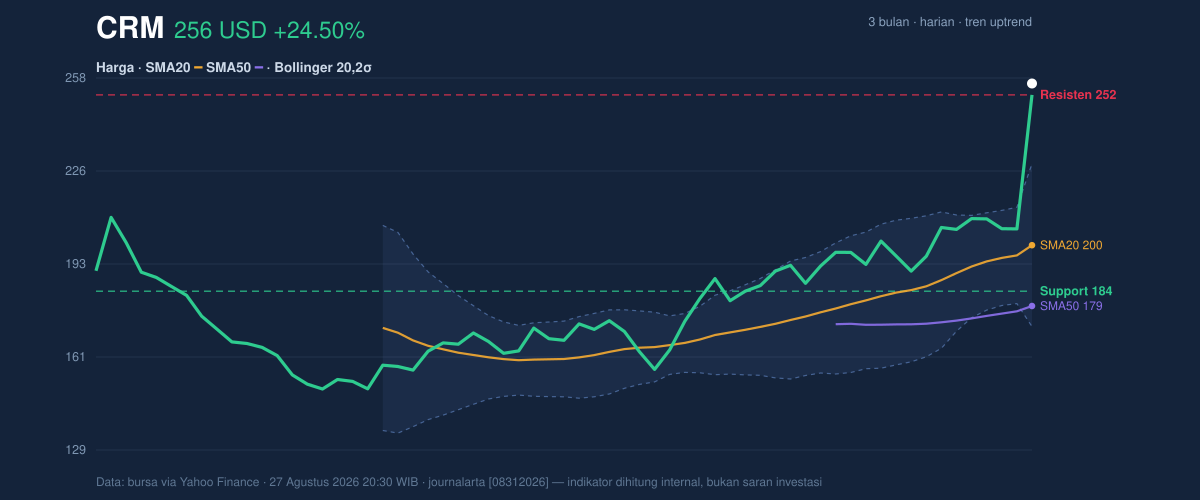
What matters here is not just that price is above the averages, but that it is now trading far above the upper Bollinger Band at 228.21. That usually means the market has moved faster than the recent volatility envelope would normally allow. In plain language, the stock is running ahead of its own recent pace. The price at 256.00 is also above the stated 20-hour resistance at 252.05, which turns that prior ceiling into a level traders will now watch for whether it becomes support.
The position within the 20-hour range is equally telling: at 106% of the range, CRM is no longer sitting inside a balanced trading band. It is pressing the top end after a sharp expansion, which often happens when momentum is strong but also when the market becomes vulnerable to a pause or pullback.
Oscillators & Momentum
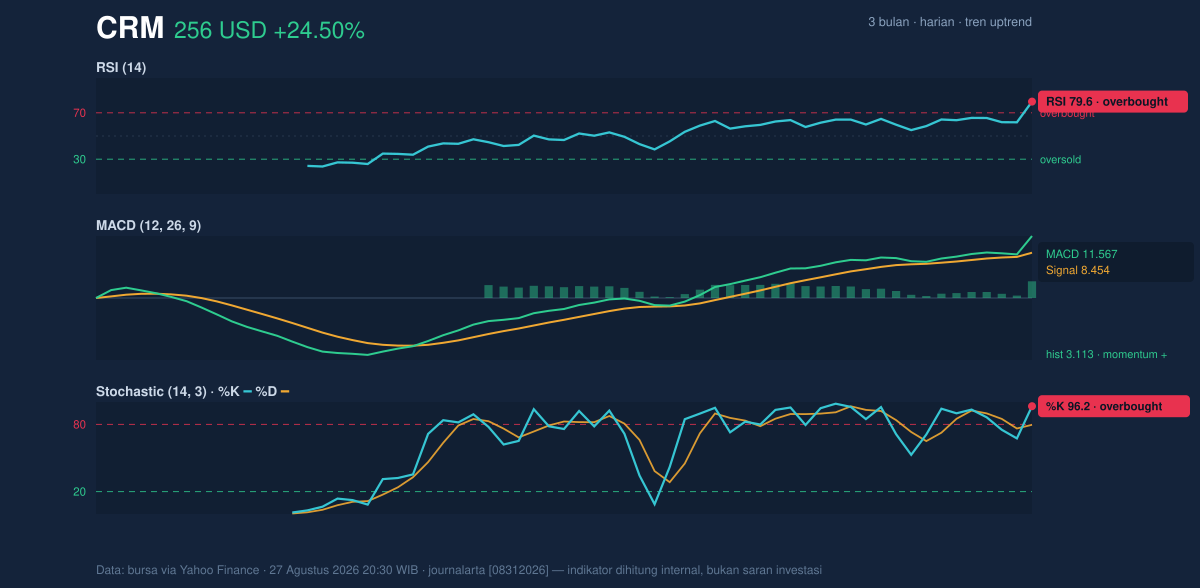
The momentum tools all point in the same direction, but they also warn that the move is extended. The RSI at 79.6 is in overbought territory, meaning buying pressure has been strong enough that the stock may be overheating in the short run. The Stochastic %K at 96.2 and %D at 79.7 reinforce that message: the shares are trading near the top of their recent range, and the pace of the move is already very mature.
At the same time, the MACD at 11.567 remains above the signal line at 8.454, with a histogram of 3.113. That matters because MACD is not just saying “the stock is high”; it is saying upward momentum is still outrunning the slower trend line. In other words, the rally has not yet lost internal force. The tension between a strong MACD and overbought RSI/Stochastic is the key story: momentum is still positive, but the stock is now in the zone where strong trends often become more volatile and less forgiving.
Volatility & Volume
The volatility backdrop confirms that this is not a quiet advance. Bollinger Bands are measuring 28.2% wide and are explicitly expanding, which indicates the market expects larger price swings than it did recently. The ATR(14) at 10.42, or 4.1% of price, says the average daily move is sizable; for readers, ATR is a measure of how much the stock typically wiggles, and here the wiggle is large enough to matter for anyone tracking short-term swings.
Volume adds credibility to the breakout. Last session volume was 55,517,500, nearly 3.9× the 20-hour average of 14,061,165, while OBV is rising. That combination suggests the move is being backed by broad participation rather than a thin, low-liquidity spike. When price breaks higher on heavy volume and OBV rises, it usually means institutions and larger traders are involved, not just fast retail flows.
Key Levels & Scenarios
The nearest technical reference points are clear. Immediate support sits at 252.05, the 20-hour resistance level that price has now exceeded. Below that, the next meaningful floor is 184.02, the 20-hour support. On the upside, the stock has already pushed beyond the Bollinger upper band at 228.21, so the chart is in a price-extension phase rather than a normal range-trading phase.
If CRM can hold above 252.05, the market is signaling that the breakout is being accepted rather than rejected. If it slips back below that level, the move starts to look more like an overextension test. A fall through 184.02 would be a much more serious shift, because it would mean the recent surge has failed to hold even its broader short-term base. The 3-month high at 254.48 is also important: trading above it means the stock has entered a fresh high zone, where price discovery can continue but where air pockets can also appear quickly.
Technical Verdict: HOLD (wait & see)
HOLD (wait & see)
- RSI at 79.6 and Stochastic %K at 96.2 show the stock is stretched and vulnerable to a pause.
- MACD remains positive at 11.567 versus 8.454, so the trend is still alive and not yet broken.
- Bollinger Bands are expanding and price is above 252.05, which supports the breakout but also raises the chance of sharp swings.
Verdict invalidated if price breaks below 184.02.
- Ideal entry range: 252.05 to 228.21
- Exit target: 256.00 and, if momentum persists, the next move is above the current high zone
- Stop loss protection: 184.02
In plain English, CRM is strong, but it is also running hot enough that patience matters more than chasing the move.
Summary Data CRM
| Last price | 256.00 USD |
| Change 1 day / 5 days / 1 month | 24.50% / 24.62% / 41.66% |
| Trend / MA-cross | uptrend / none |
| SMA20 / SMA50 | 199.98 / 178.87 |
| RSI (14) / Stochastic %K | 79.6 / 96.2 |
| Bollinger %B / ATR | 149% / 10.42 |
| Support / Resistance 20 days | 184.02 / 252.05 |
| Data as of | 27 Agustus 2026 20:30 WIB |
Track CRM stock price daily: live levels, support/resistance and our full CRM analysis history.