Tencent Momentum Weakens: Stock Gains 1.65% (Agustus 31, 2026)
On Agustus 31, 2026: price 455.20 HKD, trend sideways, RSI 50.6, support 440.00, resistance 492.20. technical analysis of tencent stock.
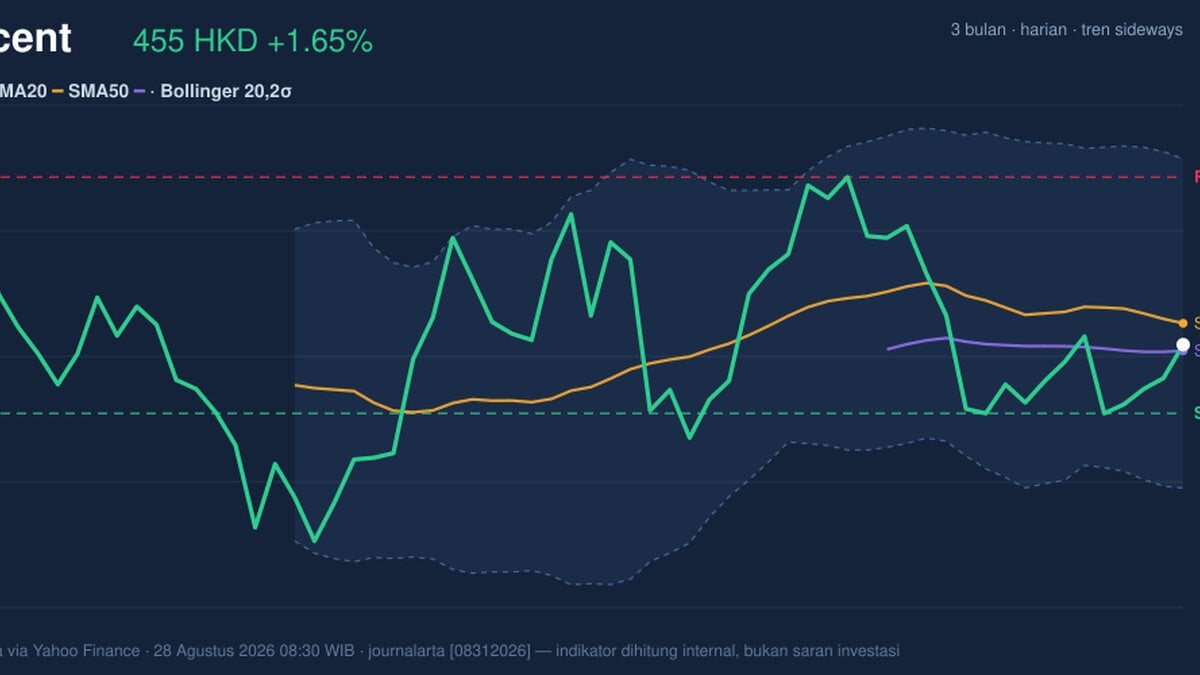
Tencent Holdings traded in Hong Kong on 28 August 2026 with the shares at HKD 455.20, up 1.65% on the day, but the move still leaves the stock below its short-term trend line and sitting in the lower third of its recent range, according to data from the exchange via Yahoo Finance. That combination matters: the bounce shows buyers are still willing to step in, yet the fact that price remains under SMA20 at HKD 459.89 suggests the rebound has not yet turned into a clean recovery.
Trend & Price Action
The broader picture is still one of consolidation rather than a decisive trend. Tencent is marked as sideways, and the SMA20 slope of -0.79% over 5 days shows the near-term average is drifting lower, even though the SMA50 at HKD 453.80 sits just beneath the current price. That positioning is important: trading above the longer average but below the shorter one often signals a market that is stabilising, but has not yet regained short-term control.
The stock’s current level also tells a story about market placement. At 29% of the 20-day range, Tencent is closer to support than resistance, which implies the market has not fully repaired the weakness seen over the past month, when the shares fell 4.21%. The 3-month band reinforces that view: the stock is still well below the 3-month high of HKD 497.80, though it remains above the 3-month low of HKD 411.00.
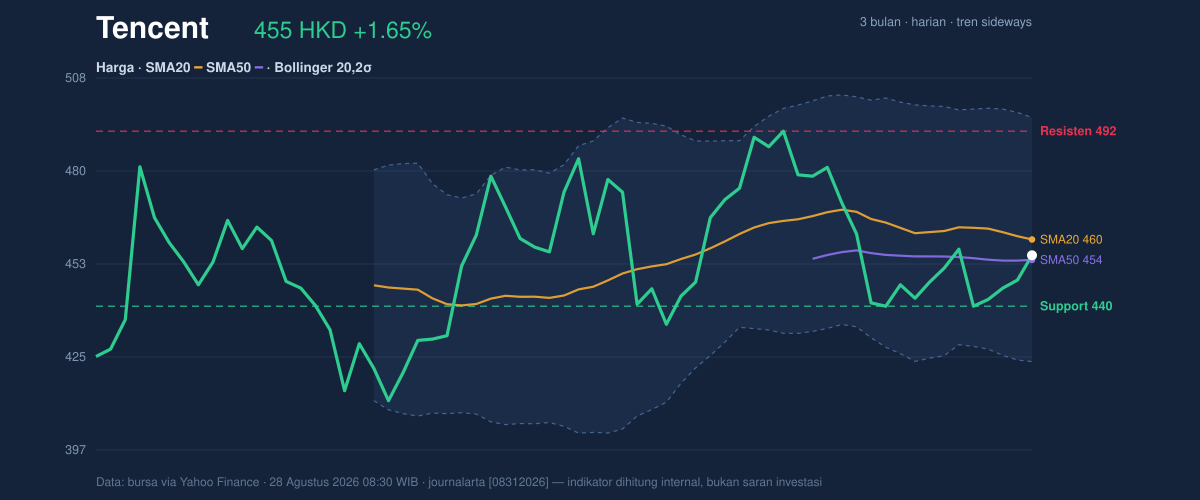
The chart matters because it shows a stock trying to hold itself together, not one already in a strong uptrend.
Oscillators & Momentum
Momentum is mixed, and that is the clearest message from the oscillator set. RSI at 50.6 is neutral, which means the market is neither overbought nor oversold; it is simply balanced. That often happens in transition phases, when the next move has not yet been confirmed by stronger participation. Stochastic %K at 40.2 and %D at 28.2 also point to a neutral setup, but with %K above %D, there is a modest short-term improvement in momentum. It is not a strong bullish signal, but it does suggest the recent rebound has some traction.
The more cautionary signal comes from MACD. MACD at -3.545, below the signal line at -2.570, with a histogram of -0.976, indicates momentum is still negative. In plain language, the stock is rising in price, but the underlying trend engine has not yet flipped into positive territory. That gap between price and momentum is often what traders watch for when trying to judge whether a bounce is real or merely a pause in a broader drift.
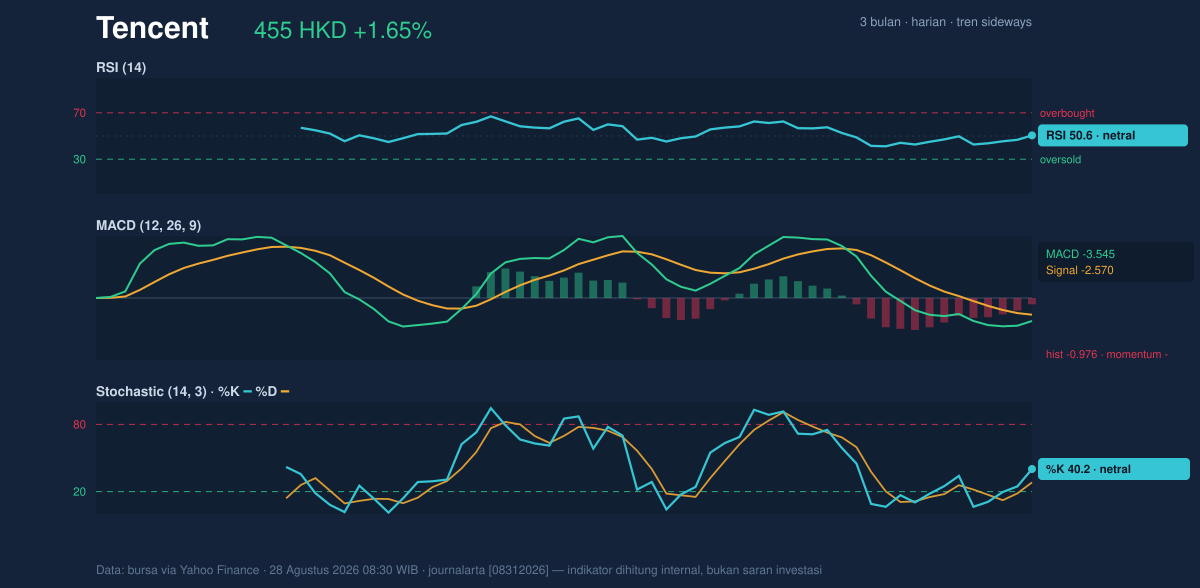
This is the kind of setup where the next few sessions matter more than the last few.
Volatility & Volume
Volatility is present, but not extreme. ATR at 12.21, equal to 2.7% of price, suggests a normal daily swing for a large-cap name rather than a disorderly move. Bollinger Bands add another layer: price is trading below the middle band at HKD 459.89, with %B at 44% and a 15.8% band width, which is described as normal. That means there is no squeeze signalling an imminent breakout, but also no band expansion warning of panic. In other words, the stock is in a regular trading environment where a move can still develop, but it needs a catalyst.
Volume offers a small positive clue. Last volume came in at 27,742,475, above the 20-session average of 24,392,391, or 1.1x normal. That tells us the day’s advance was not empty; more shares changed hands than usual, so the rebound had participation. OBV is rising, which is useful because it suggests buyers have been accumulating on balance even if the price has not yet broken out. Rising OBV alongside a neutral RSI can be a sign that demand is quietly improving before the chart fully reflects it.
Key Levels & Scenarios
Tencent’s immediate map is fairly clear. Support sits at HKD 440.00, while resistance is HKD 492.20. The stock is currently much closer to support than resistance, which means the market is still vulnerable if the rebound stalls. The lower Bollinger band at HKD 423.47 is a deeper technical floor, and the upper band at HKD 496.31 aligns closely with the recent range ceiling. That cluster near the high-490s is where the market would need to prove that the recent weakness has been absorbed.
If price can reclaim and hold above SMA20 at HKD 459.89, the chart would look healthier because the stock would be back above the level that has been capping short-term momentum. If it fails and slips back under HKD 440.00, the setup weakens quickly, because that would put the shares back into the lower part of the recent range and closer to the band that has been supporting the market.
Technical Verdict: HOLD (wait & see)
HOLD (wait & see)
- RSI at 50.6 and Stochastic at 40.2 / 28.2 are neutral, so momentum is not strong enough to confirm a clean trend.
- MACD is negative with the histogram below zero, which says the underlying trend still lacks confirmation.
- Price is below SMA20 at HKD 459.89 but above SMA50 at HKD 453.80, a classic in-between setup that often needs more evidence.
- Verdict invalidated if price breaks below HKD 440.00, because that would weaken the current support structure and reopen downside pressure.
- Ideal Entry Range: HKD 453.80 to 459.89
- Exit Target: HKD 492.20 to 496.31
- Stop Loss protection: below HKD 440.00
For non-traders, this means the stock is not weak enough to dismiss, but not strong enough yet to call a clean recovery.
“The market is waiting for Tencent to prove that this bounce is more than just a pause.”
Summary Data Tencent
| Last price | 455.20 HKD |
| Change 1 day / 5 days / 1 month | 1.65% / -0.39% / -4.21% |
| Trend / MA-cross | sideways / none |
| SMA20 / SMA50 | 459.89 / 453.80 |
| RSI (14) / Stochastic %K | 50.6 / 40.2 |
| Bollinger %B / ATR | 44% / 12.21 |
| Support / Resistance 20 days | 440.00 / 492.20 |
| Data as of | 28 Agustus 2026 08:30 WIB |
Track Tencent share price daily: live levels, support/resistance and our full Tencent analysis history.