HSBC Stock Drops 0.78%, Momentum Gains In Focus
On September 11, 2026: price 164.70 HKD, trend uptrend, RSI 56.2, support 160.30, resistance 167.60. technical analysis of hsbc stock. HSBC Stock Drops — full…
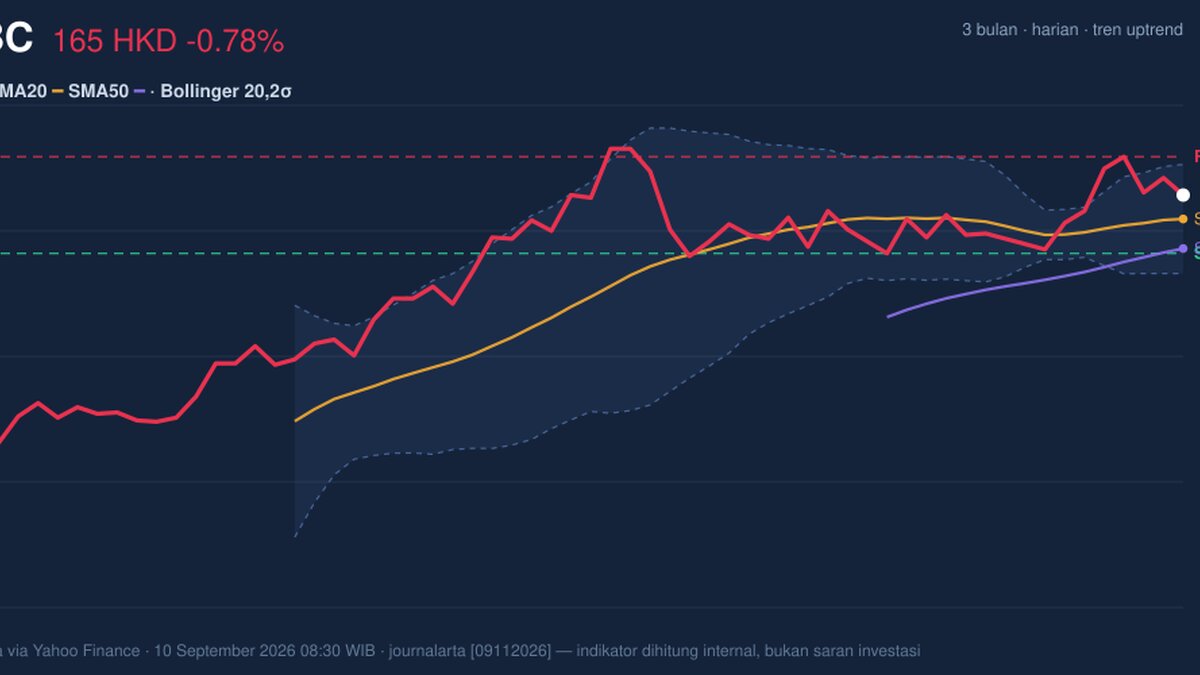
HSBC Holdings traded at 164.70 HKD on HKEX, down 0.78% from the previous close of 166.00, but the more important signal is that the stock is still holding above its short- and medium-term trend lines. The shares sit above SMA20 at 162.90 and SMA50 at 160.67, which tells the market is not merely bouncing on noise: it remains in an established uptrend, even if the latest session was softer. The chart also shows price sitting around the middle-upper part of its recent range, with room to test higher resistance if momentum keeps building.
Trend & Price Action
As shown in the chart, HSBC’s price structure is constructive rather than stretched. The uptrend is being supported by the SMA20 rising at 0.62% over 5 days, a useful sign because a climbing short-term average usually means buyers are still willing to step in on dips. The lack of a fresh MA-cross matters too: there is no new moving-average crossover to signal a trend reversal, so the current setup is more about continuation than a dramatic shift in direction.
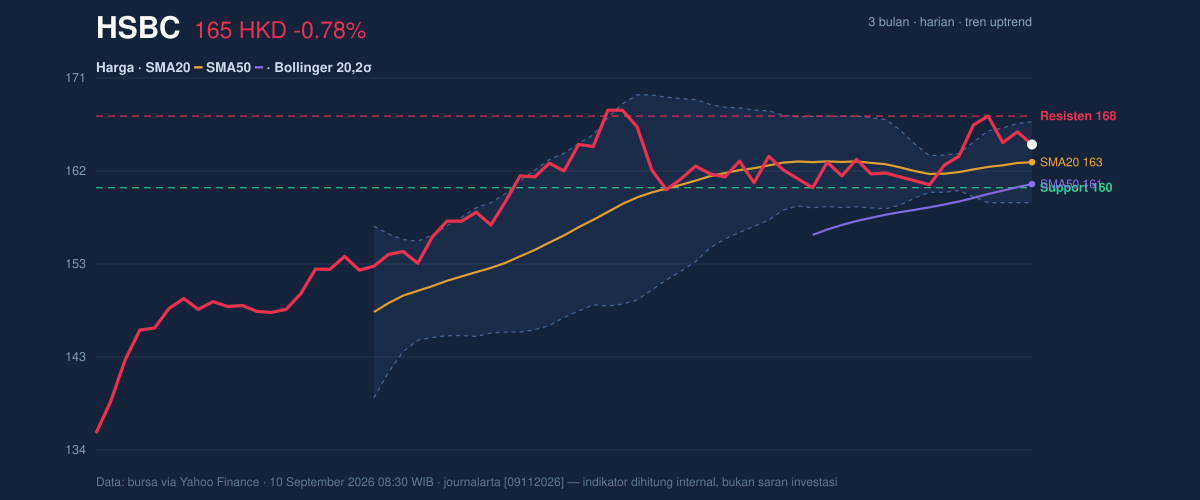
Price is also trading between clearly defined boundaries: support at 160.30 and resistance at 167.60. That places the stock at about 60% of the range, which is a slightly bullish position because it is closer to the upper half than the lower half. The stock’s 3-month high of 169.70 sits just above the current resistance zone, so the market is effectively testing whether this recent advance can extend back toward the top of the broader range.
A mild pullback inside an uptrend is not a breakdown.
Oscillators & Momentum
The momentum picture is mixed in a healthy way, not in a warning-sign way. RSI at 56.2 is neutral, which means the stock is neither overbought nor oversold. That matters because a neutral RSI in an uptrend often suggests the move still has room to continue without being technically overextended. Stochastic %K at 64.8 and %D at 70.3 is also neutral, though the %K sitting below %D hints that short-term momentum has cooled a little. In plain English: the stock is not losing its trend, but it is pausing after a recent push.
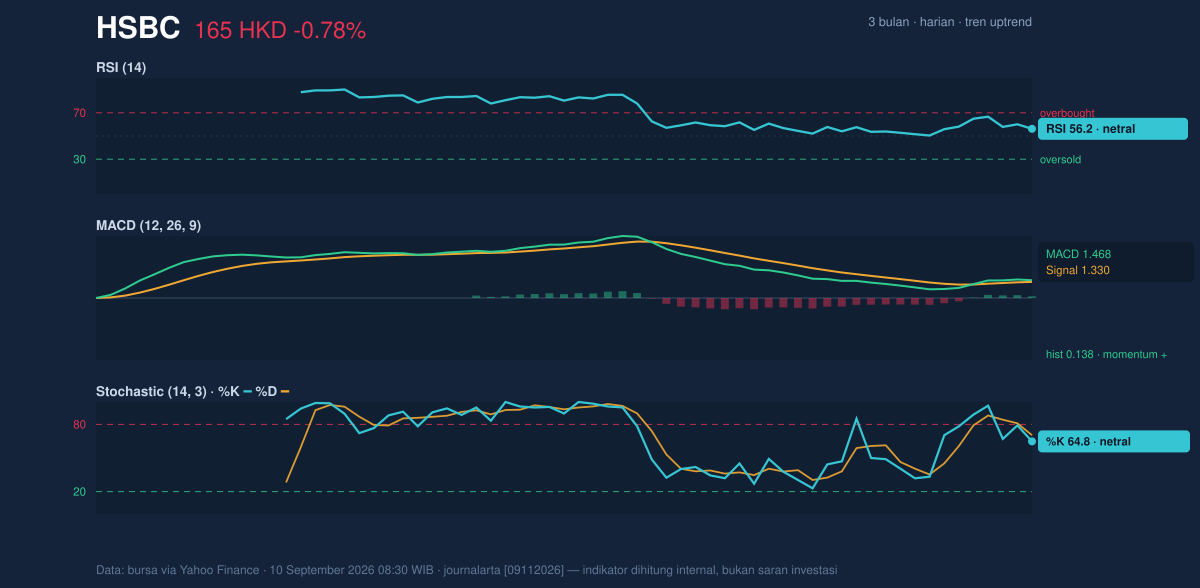
The more encouraging signal comes from MACD at 1.468 versus its signal line at 1.330, with a positive histogram of 0.138. MACD is a trend-following momentum tool, and a positive histogram means the faster line is still above the slower signal line, so upward momentum remains intact. That is especially relevant here because the oscillator set is not overheated; the stock has momentum, but not excess momentum. In technical terms, that is often the cleaner setup for continuation.
Volatility & Volume
Volatility is subdued. The ATR(14) of 2.31, equal to 1.4% of price, indicates relatively low daily movement. ATR measures the typical trading range, so a low reading suggests the stock is not swinging wildly and may be coiling rather than expanding. That fits with the Bollinger Band data: the upper band is 167.02, the middle band is 162.90, and the lower band is 158.78, while the band width of 5.1% is described as a squeeze. A squeeze means volatility has compressed, which often precedes a larger move once price leaves the range.
The current %B of 72% shows price is trading in the upper portion of the Bollinger envelope, but not pressing the extreme top. That is an important distinction: the stock is firm, yet not so extended that it clearly looks exhausted. Volume, however, is less convincing in the short term. The latest volume of 6,179,267 is only 0.6× the 20-day average of 9,835,216, which means the latest move happened on lighter participation than usual. Still, OBV is rising, and that matters because On-Balance Volume tracks whether trading flow is accumulating over time. Rising OBV alongside a stable uptrend suggests the broader buying bias is still present even if the latest session was quiet.
Low volume on a calm day is not the same as distribution.
Key Levels & Scenarios
The immediate battlefield is clear. 167.60 is the first resistance to watch, and it sits just above the Bollinger upper band at 167.02. If price can move through that zone, the market would be probing the upper edge of the recent structure and potentially aiming back toward the 3-month high of 169.70. On the downside, 160.30 is the key support that has to hold to preserve the current constructive setup. A break below that level would weaken the short-term trend and increase the chance of a deeper retracement toward the lower Bollinger band at 158.78.
The current position is therefore a compression story: price is near the upper half of the range, momentum is positive but not overheated, and volatility is tight enough to allow a sharper move in either direction. The signal to watch is not just whether HSBC rises, but whether it does so with enough participation to escape the squeeze.
Technical Verdict: HOLD (wait & see)
HOLD (wait & see)
- Reason 1: Price remains above SMA20 at 162.90 and SMA50 at 160.67, confirming the broader uptrend is still intact.
- Reason 2: MACD is positive and the histogram is above zero, which supports ongoing momentum.
- Reason 3: Bollinger Band width is only 5.1%, showing a squeeze; that often leads to a decisive move, but not yet a confirmed one.
- Verdict invalidated if price falls below 160.30, because that would break the nearest support and weaken the current structure.
- Ideal Entry Range: 162.90 to 160.30
- Exit Target (Target Price): 167.60, then 169.70
- Stop Loss protection: below 160.30, with the lower Bollinger band at 158.78 as the next technical reference
For non-traders, this means HSBC is still trending higher, but the stock is waiting for a stronger breakout signal before the next move becomes clearer.
The latest volume was 6,179,267 shares versus a 20-day average of 9,835,216.
Summary Data HSBC
| Last price | 164.70 HKD |
| Change 1 day / 5 days / 1 month | -0.78% / 0.73% / 1.04% |
| Trend / MA-cross | uptrend / none |
| SMA20 / SMA50 | 162.90 / 160.67 |
| RSI (14) / Stochastic %K | 56.2 / 64.8 |
| Bollinger %B / ATR | 72% / 2.31 |
| Support / Resistance 20 days | 160.30 / 167.60 |
| Data as of | 10 September 2026 08:30 WIB |
Track HSBC share price daily: live levels, support/resistance and our full HSBC analysis history.