MSFT Stock Technicals: Gains 0.09% on Wednesday, Testing Key Resistance
On October 7, 2026: price 529.76 USD, trend uptrend, RSI 68.3, support 490.30, resistance 529.76. technical analysis of msft stock. MSFT Stock Technicals —…
Why MSFT is in focus today
- Trading near its 3-month high (535.69)
- Uptrend confirmed (5-day change 3.29%)
Selected automatically from 32 NASDAQ (US) stocks by a technical-signal score with daily weighted randomisation — not a recommendation.
Trend & Price Action
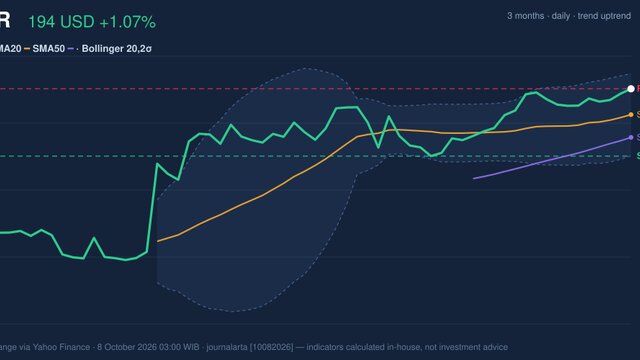
Microsoft’s price sits above its 20-day simple moving average (SMA) of $506.62 and its 50-day SMA of $496.13. A simple moving average smooths daily price changes to show the underlying direction; the shorter average is also rising, with its slope up 1.22% over five days. Together, those readings support an uptrend rather than a rally driven by a single session. There has been no new crossover between the averages, so the signal comes from price holding above both, not from a fresh technical trigger. The stock is at 100% of its stated 20-day range, with $529.76 as resistance and $490.30 as support. Its proximity to the three-month peak shows demand has carried the shares a long way from the $373.35 low. It also means there is little recent overhead trading history to show where sellers might emerge if the price pushes higher. As shown in the chart, the latest price is close to the upper Bollinger band at $530.41. Bollinger bands frame typical price variation around a moving average; a reading of 99% on the band measure places the shares near the upper edge. The band width is 9.4%, described as normal, so this is not a squeeze signaling unusually quiet trading or an expansion signaling sharply elevated volatility.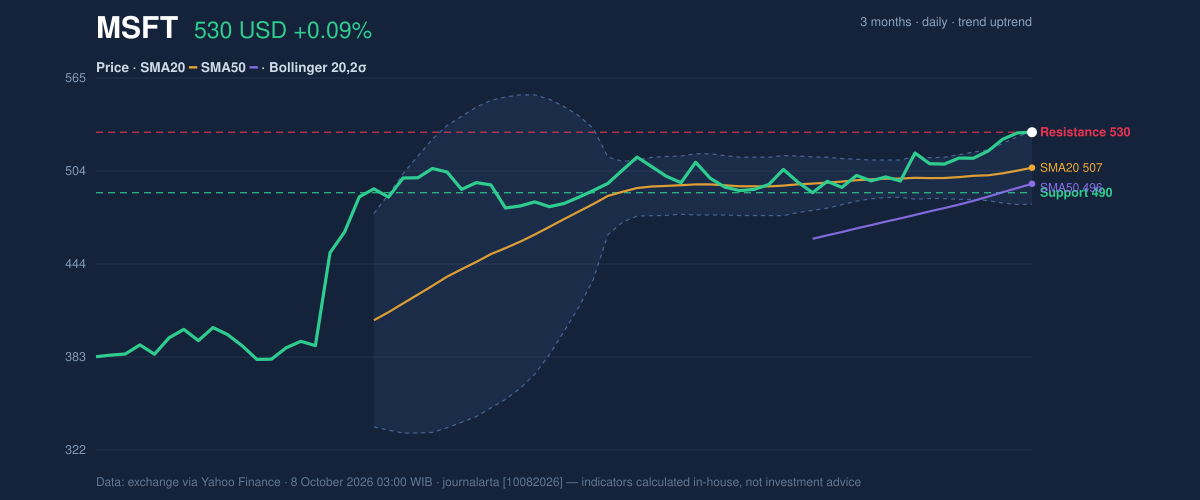
Oscillators & Momentum
Momentum indicators broadly lean positive, but they also show the advance is stretched in the short term. The MACD is positive at 10.168, above its 8.529 signal line, and its positive histogram of 1.640 indicates the faster trend remains stronger than the comparison line. This supports the broader price advance, though it does not guarantee another leg higher. The RSI is 68.3, classified as neutral in the supplied data, while the Stochastic readings of 86.7 and 85.5 are overbought. RSI measures the pace of recent gains and losses; Stochastic compares the closing price with its recent range. The latter’s elevated readings suggest buyers have pushed price toward the top of that range, making a pause or pullback more plausible even as the MACD remains constructive.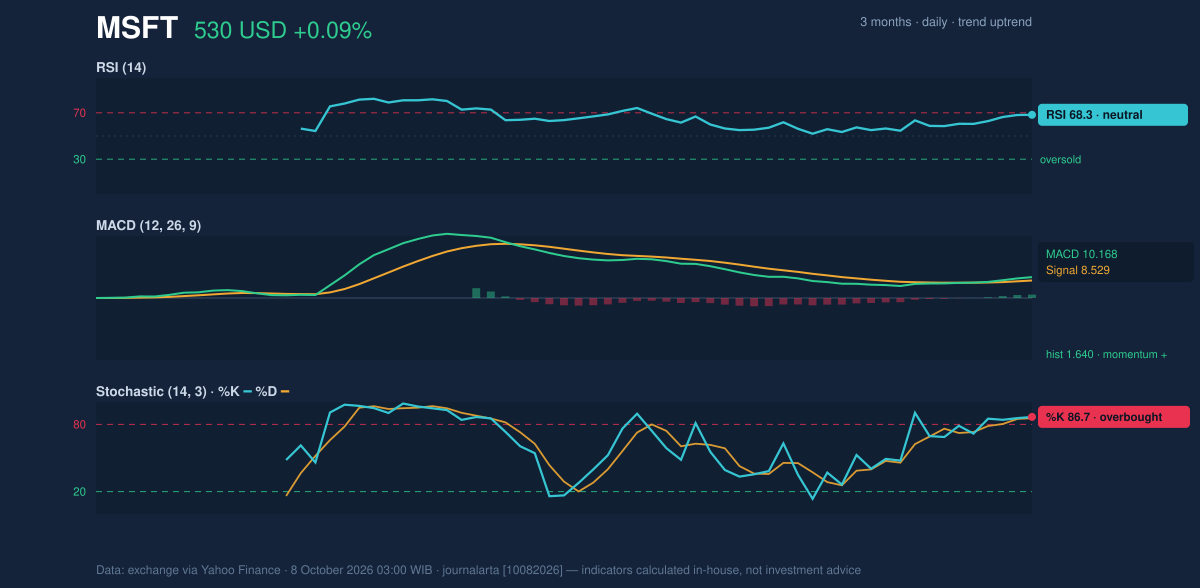
Volatility, Volume & Key Levels
Average true range (ATR), a measure of typical daily price movement, is $11.92, or 2.2% of the share price, indicating moderate volatility. That provides context for interpreting small daily moves: the latest 0.09% gain is far smaller than the measured typical range. Trading volume was 16,773,600 shares, about 0.8 times the 20-day average of 21,985,555. The advance therefore lacked unusually strong participation in the latest session. On the other hand, the on-balance volume indicator is rising, suggesting that buying pressure has been building across the period measured rather than disappearing altogether. The near-term test is whether price can sustain a break above the $530.41 upper band and then move beyond the $535.69 three-month high. A failure to hold the current area could bring the rising 20-day average at $506.62 into view; the stated range support at $490.30 is a deeper reference point. A close below that support would materially weaken the technical case.Technical Verdict: HOLD (wait & see)
The technical picture is positive but mixed at the current level: price remains above rising moving averages and MACD momentum is positive, while the stock is at the top of its range, Stochastic is overbought, and the latest volume is below average. The HOLD (wait & see) verdict reflects an uptrend without clear confirmation that the shares can extend the breakout. It is invalidated if the price falls below $490.30. - Indicative entry range: $506.62–$529.76, bounded by the 20-day average and current resistance. - Indicative exit target: $535.69, the three-month high and next stated resistance reference. - Stop-loss protection level: $490.30, the 20-day support level. In plain English, the trend is upward, but the price is stretched enough that a pause would not be surprising.| Indicator | Reading |
|---|---|
| Last price | $529.76 |
| Daily / five-day / one-month change | +0.09% / +3.29% / +7.75% |
| SMA20 / SMA50 | $506.62 / $496.13 |
| RSI(14) | 68.3 (neutral) |
| Stochastic %K / %D | 86.7 / 85.5 (overbought) |
| MACD / signal / histogram | 10.168 / 8.529 / 1.640 |
| Bollinger upper / middle / lower | $530.41 / $506.62 / $482.83 |
| ATR(14) | $11.92 (2.2%) |
| Volume / 20-day average | 16,773,600 / 21,985,555 |
| 20-day support / resistance | $490.30 / $529.76 |
| Three-month high / low | $535.69 / $373.35 |
Summary Data MSFT
| Last price | 529.76 USD |
| Change 1 day / 5 days / 1 month | 0.09% / 3.29% / 7.75% |
| Trend / MA-cross | uptrend / none |
| SMA20 / SMA50 | 506.62 / 496.13 |
| RSI (14) / Stochastic %K | 68.3 / 86.7 |
| Bollinger %B / ATR | 99% / 11.92 |
| Support / Resistance 20 days | 490.30 / 529.76 |
| Data as of | 8 October 2026 03:00 WIB |
Disclaimer: This technical analysis is generated automatically from exchange data (via Yahoo Finance) and indicators calculated by JournalArta, for information and education only. The verdict and the entry, target and stop-loss levels are not investment advice or a solicitation to buy or sell any security. Investment decisions and their risks rest solely with the reader.
Track MSFT stock price daily: live levels, support/resistance and our full MSFT analysis history.