MA Stock Gains 1.01% on Monday, Testing Key Resistance
On October 12, 2026: price 595.09 USD, trend sideways, RSI 67.6, support 550.00, resistance 595.09. technical analysis of ma stock. MA Stock Gains — full…
Trend & Price Action
Mastercard’s trend is classified as sideways, although its short-term structure has improved. The share price is above its 20-day simple moving average, or SMA, at $566.75, and the 20-day average is rising 0.43% over five days. The price also stands above the 50-day SMA at $572.55. These averages indicate that recent trading has strengthened, but with no new moving-average crossover, they do not yet confirm a decisive trend change. The stock is at 100% of its 20-day range, with resistance at $595.09, while the three-month high of $601.23 is close overhead. That leaves little room before the next visible hurdle. As shown in the chart, price has moved above the short-term averages and the upper Bollinger band, but confirmation would require sustained trading beyond the nearby resistance zone.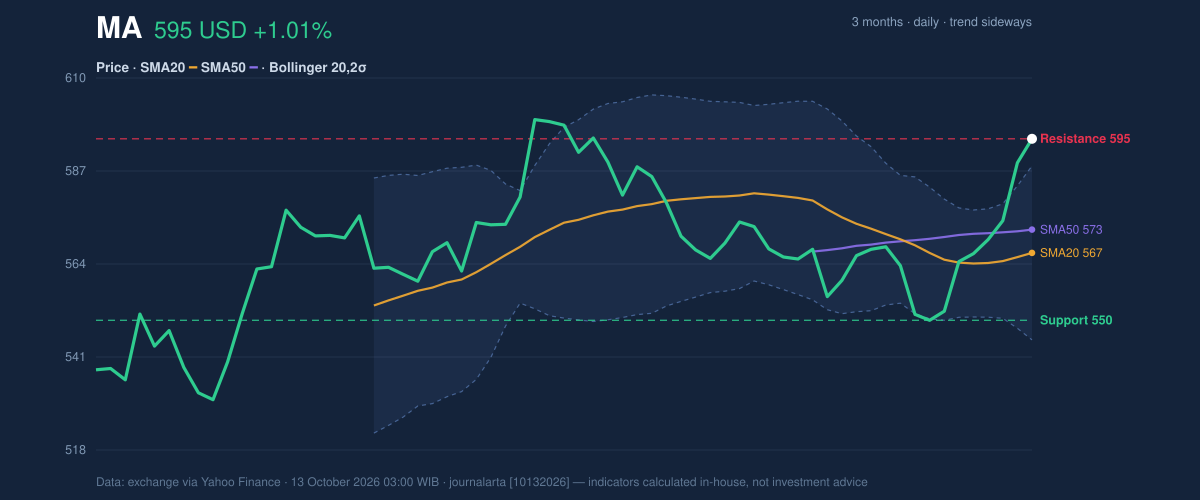
Oscillators & Momentum
Momentum indicators lean positive, though they also warn that the advance may be stretched. The RSI is 67.6, classified as neutral; RSI measures the pace of recent price changes, and this reading is close to—but not at—the commonly watched overbought threshold. The Stochastic reading is overbought, with %K at 92.8 and %D at 89.7. Stochastic compares a closing price with its recent trading range, so readings this high show that price is near the upper end of that range. They can persist in a strong market, but they also raise the chance of a pause or pullback. The MACD provides a constructive counterweight: MACD is positive at 2.609, with a 3.767 histogram and a signal line at -1.158. MACD compares shorter- and longer-term moving averages to gauge momentum; a positive histogram indicates strengthening momentum relative to its signal line. Together, the indicators describe upward pressure that is real but increasingly crowded.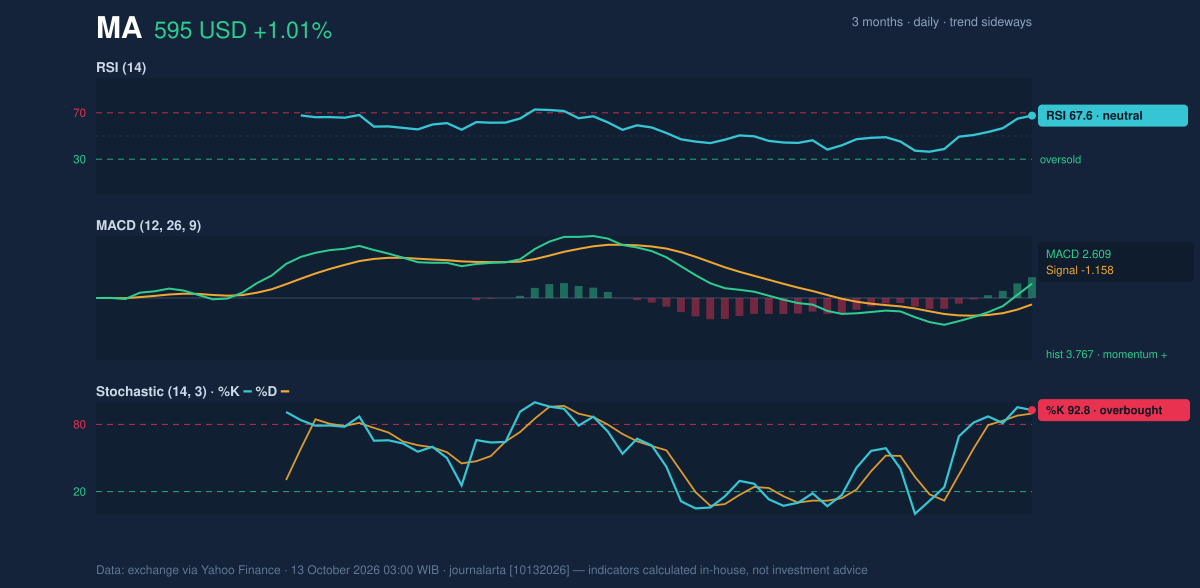
Volatility, Volume & Key Levels
The Bollinger bands are narrowing, with a width of 7.6%, indicating that recent price swings have been relatively compressed. Mastercard is now above the upper band at $588.35, with %B at 116%. %B shows where the price sits relative to the bands; a reading above 100% means it has moved beyond the upper boundary. That can accompany a breakout, but it can also mark a short-term extension. The 14-day ATR is $10.08, or 1.7% of the share price, pointing to moderate daily volatility rather than an unusually turbulent market. Participation is close to normal: volume was 2,906,100 shares, against a 20-day average of 2,880,200, while OBV is rising. OBV tracks whether volume accompanies gains or losses; its upward direction supports the view that buying interest has accumulated, though volume near average does not show an exceptional surge of conviction. The main levels are $595.09 resistance, $572.55 at the 50-day SMA, $566.75 at the 20-day SMA, and $550.00 support. A sustained move above resistance would strengthen the breakout case and bring the three-month high of $601.23 into focus. If the price falls back below the moving averages, the breakout signal would weaken; a break below $550 would invalidate the constructive short-term setup.Technical Verdict: HOLD (wait & see)
HOLD (wait & see) fits the mixed technical picture: MACD is positive and OBV is rising, but the stock is pressing against resistance while Stochastic is overbought and price has extended above the upper Bollinger band. The sideways trend classification and lack of a new moving-average crossover further argue against treating the breakout as established. The verdict is invalidated if price breaks below $550.00.- Ideal Entry Range: $566.75–$572.55, around the 20-day and 50-day moving averages.
- Exit Target (Target Price): $601.23, the three-month high.
- Stop Loss protection: $550.00, the 20-day support level.
Data
Source: Exchange data via Yahoo Finance, as of October 13, 2026, 03:00 WIB. Prices in US dollars.
Why MA is in focus today
- Trading near its 3-month high (601.23)
- Breaking out of a Bollinger squeeze (band width 7.6%)
Selected automatically from 30 NYSE (US) stocks by a technical-signal score with daily weighted randomisation — not a recommendation.
Summary Data MA
| Last price | 595.09 USD |
| Change 1 day / 5 days / 1 month | 1.01% / 5.40% / 3.60% |
| Trend / MA-cross | sideways / none |
| SMA20 / SMA50 | 566.75 / 572.55 |
| RSI (14) / Stochastic %K | 67.6 / 92.8 |
| Bollinger %B / ATR | 116% / 10.08 |
| Support / Resistance 20 days | 550.00 / 595.09 |
| Data as of | 13 October 2026 03:00 WIB |
Disclaimer: This technical analysis is generated automatically from exchange data (via Yahoo Finance) and indicators calculated by JournalArta, for information and education only. The verdict and the entry, target and stop-loss levels are not investment advice or a solicitation to buy or sell any security. Investment decisions and their risks rest solely with the reader.
Track MA stock price daily: live levels, support/resistance and our full MA analysis history.