PFE Stock Gains 0.42%, Testing Key Resistance In Focus
On October 12, 2026: price 28.40 USD, trend sideways, RSI 57.5, support 27.41, resistance 28.72. technical analysis of pfe stock. PFE Stock Gains — full…
By Alistair Sterling
October 13, 20264 min read
PFE Stock Gains 0.42%, Testing Key Resistance In Focus
PFE rose 0.42% to $28.40 on Oct. 13, while trading volume came in at just 0.6 times its 20-trading-day average. Pfizer has not been covered by JournalArta in the past 14 days, and its current setup merits attention: the share price sits above its short- and medium-term moving averages, but weak trading participation and a negative MACD reading complicate the signal.
Trend & Price Action
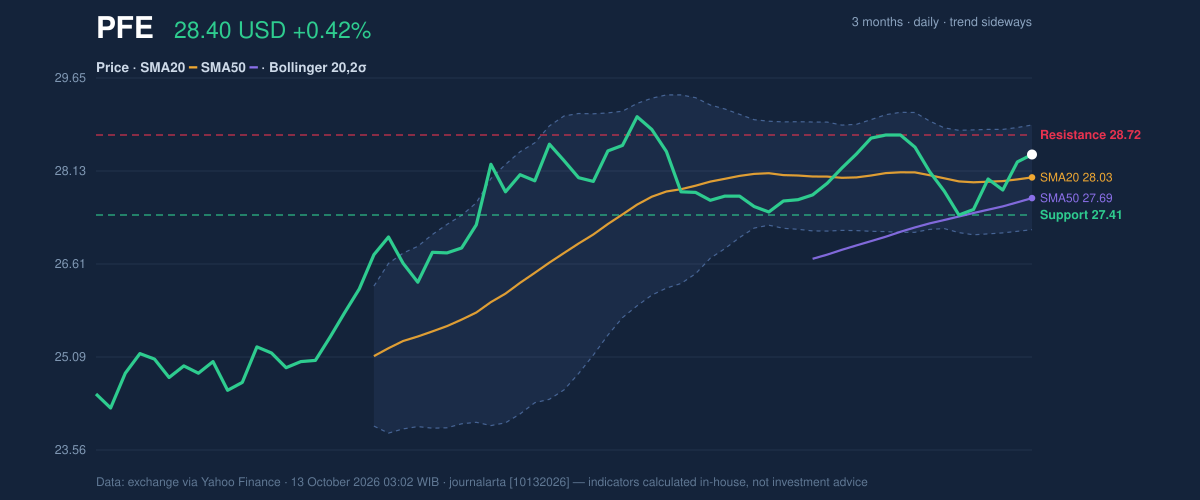
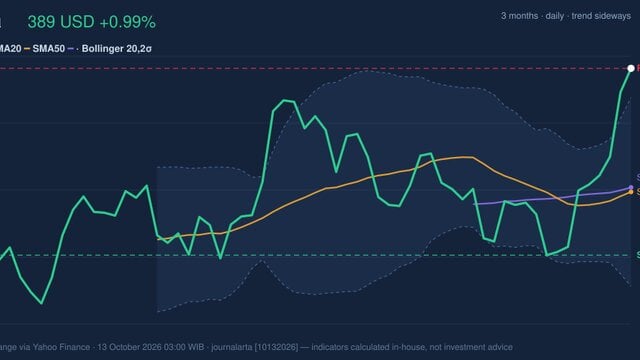
Pfizer’s shares are up 3.61% over five days and 2.45% over one month, yet the broader technical trend remains sideways. The price is above the 20-day simple moving average (SMA) of $28.03 and the 50-day SMA of $27.69. That positioning suggests recent trading has improved relative to both averages, but there has been no new crossover—a point that argues against treating the move as a confirmed change in trend.
The 20-day SMA has risen 0.24% over five days, a modest slope consistent with stabilization rather than a forceful advance. PFE is also in the upper portion of its 20-trading-day range, at 76% of the distance between support at $27.41 and resistance at $28.72. The three-month range, from $24.14 to $29.21, puts the current price nearer the top than the bottom, though still below the period high.
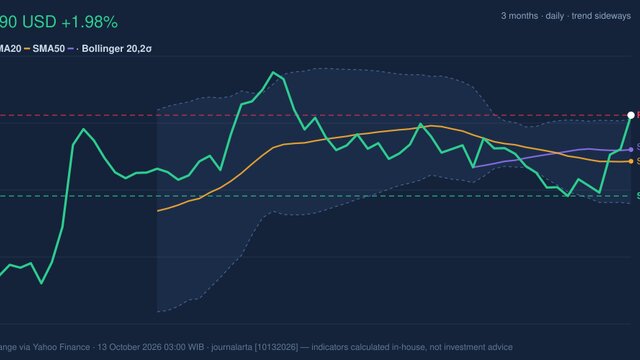
3-month price action chart of PFE: price, SMA20/50, Bollinger, support & resistance. Data: exchange via Yahoo Finance.
Oscillators & Momentum
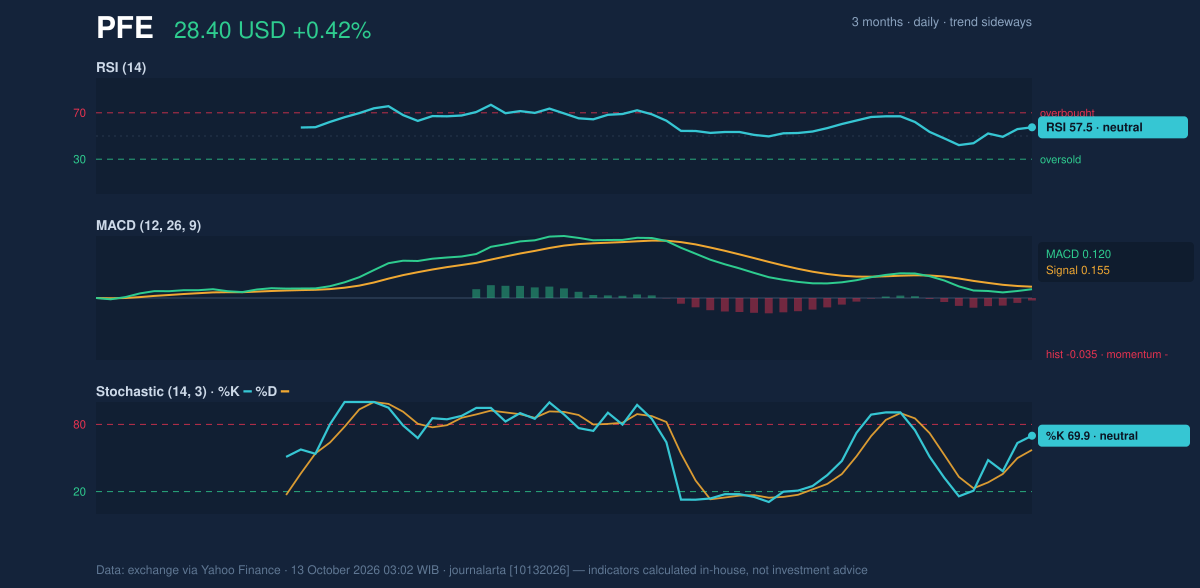
Momentum indicators are mixed rather than strongly bullish or bearish. The RSI is 57.5, a neutral reading; the relative strength index compares recent gains and losses, and this level does not point to an extreme condition. The Stochastic readings are also neutral, with %K at 69.9 and %D at 57.2. Their spread indicates firmer recent momentum in the faster %K line, but does not by itself confirm a durable breakout.
The MACD gives a more cautious signal. Its value of 0.120 remains below the 0.155 signal line, leaving the histogram negative at -0.035. MACD compares two moving averages to assess trend momentum; a negative histogram here means the latest price strength has not yet translated into improving momentum by that measure. That divergence helps explain why the shares can sit above their moving averages while the overall trend remains sideways.
Momentum chart of PFE: RSI(14), MACD, Stochastic. Data: exchange via Yahoo Finance.
Volatility & Volume
The Bollinger Bands are narrowing, with a 6.1% band width. Such a squeeze describes a period of reduced price dispersion and can precede a larger move, but it does not reveal which direction that move will take. PFE’s %B reading of 72% places the price in the upper part of the band, below the $28.88 upper boundary. The upper band is therefore a nearby reference, not evidence that a breakout has already occurred.
Average true range (ATR), a measure of typical price movement, stands at $0.54, or 1.9% of the share price—moderate volatility. That leaves room for ordinary fluctuations around nearby technical levels. Participation is less encouraging: volume was 18,544,200 shares against a 20-day average of 32,736,035, while on-balance volume (OBV), which tracks the balance of volume on rising and falling sessions, is declining. The price advance is therefore not being confirmed by stronger buying activity in the available volume measures.
Key Levels & Scenarios
A close above $28.72 resistance would put the price beyond the 20-day range ceiling and nearer the three-month high of $29.21. With bands tightening, a break could signal that the quiet trading period is ending. But thin volume and negative MACD momentum would leave the durability of such a move uncertain.
Failure to hold above the moving averages would shift attention to $28.03, the 20-day SMA, then $27.69, the 50-day SMA. A deeper retreat would bring the 20-day support at $27.41 into focus, with the lower Bollinger Band at $27.17 as another reference. Those levels are conditional markers, not guarantees of where a decline would stop.
Technical Verdict: HOLD (wait & see)
The technical picture supports a neutral stance: price is above both moving averages, but the sideways trend has no fresh MA crossover; the MACD histogram remains negative; and below-average volume alongside falling OBV weakens confirmation. The narrowing Bollinger Bands raise the possibility of a larger move, without establishing its direction.
The verdict is invalidated if PFE falls below $27.41.
- Entry range: $27.69–$28.03, bounded by the 50-day and 20-day SMAs.
- Exit target: $28.72–$28.88, spanning 20-day resistance and the upper Bollinger Band.
- Stop-loss protection: $27.17, at the lower Bollinger Band.
For non-traders, HOLD means the mixed signals do not yet show a clear technical direction.
Metric
Reading
Last price
$28.40
20-day / 50-day SMA
$28.03 / $27.69
20-day support / resistance
$27.41 / $28.72
RSI (14)
57.5
MACD histogram
-0.035
Bollinger Bands
$27.17–$28.88; width 6.1%
Volume vs. 20-day average
18,544,200 vs. 32,736,035
Summary Data PFE
Last price
28.40 USD
Change 1 day / 5 days / 1 month
0.42% / 3.61% / 2.45%
Trend / MA-cross
sideways / none
SMA20 / SMA50
28.03 / 27.69
RSI (14) / Stochastic %K
57.5 / 69.9
Bollinger %B / ATR
72% / 0.54
Support / Resistance 20 days
27.41 / 28.72
Data as of
13 October 2026 03:02 WIB
Disclaimer: This technical analysis is generated automatically from exchange data (via Yahoo Finance) and indicators calculated by JournalArta, for information and education only. The verdict and the entry, target and stop-loss levels are not investment advice or a solicitation to buy or sell any security. Investment decisions and their risks rest solely with the reader.