CapitaLand Investment Stock Analysis: Drops 0.00%, RSI Oversold
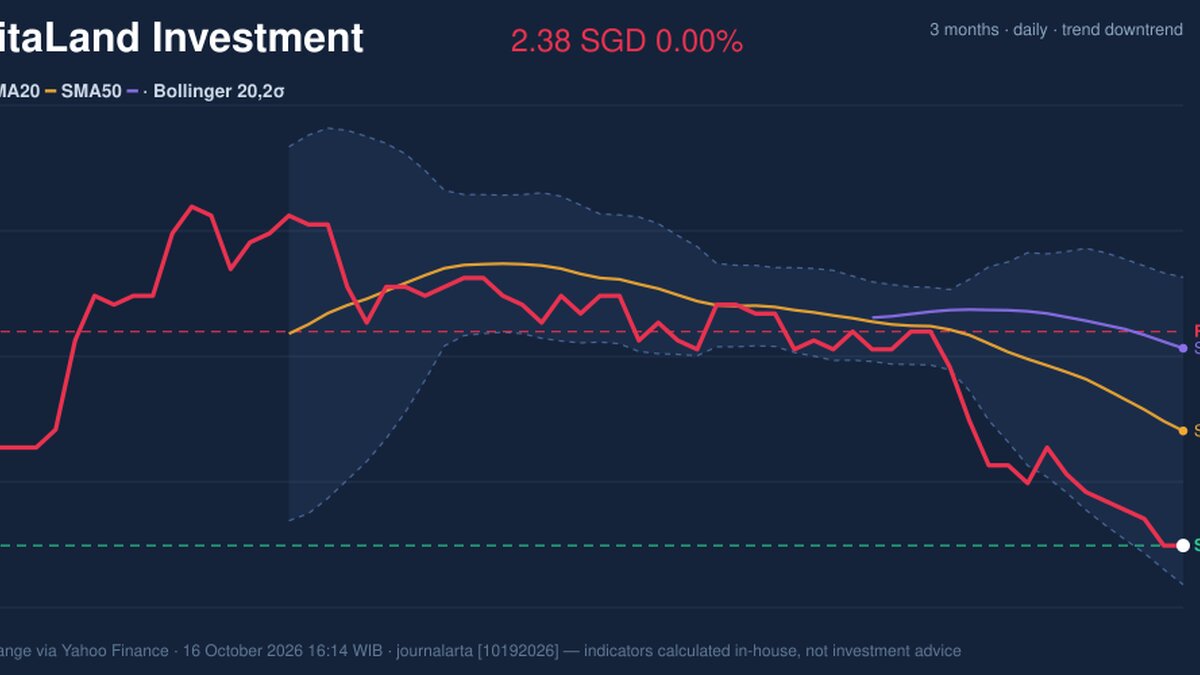
On October 16, 2026: price 2.38 SGD, trend downtrend, RSI 24.2, support 2.38, resistance 2.62. technical analysis of capitaland investment stock.
Why CapitaLand Investment is in focus today
- Closed at a 20-day low (2.38)
- Trading near its 3-month low (2.37)
- RSI(14) at 24.2 — oversold zone
- Downtrend extending (5-day change -2.46%)
Selected automatically from 16 SGX (Singapore) stocks by a technical-signal score with daily weighted randomisation — not a recommendation.
Trend & Price Action
The broader technical picture remains weak. CapitaLand Investment trades below its 20-day moving average (SMA20), at S$2.51, and its 50-day average, at S$2.60. The SMA20 is falling by 2.26% over five days, signalling that recent weakness is not merely a single-session dip. No fresh moving-average crossover has formed, so there is no new technical signal suggesting the trend has turned. The share price sits at the bottom of its 20-day range, with support at S$2.38 and resistance at S$2.62. It is only slightly above the three-month low of S$2.37. A move below these nearby floors would matter because it would put the stock into fresh low territory within the period measured by the data. Conversely, a bounce would still need to reclaim the moving averages before it could be read as a meaningful improvement in trend.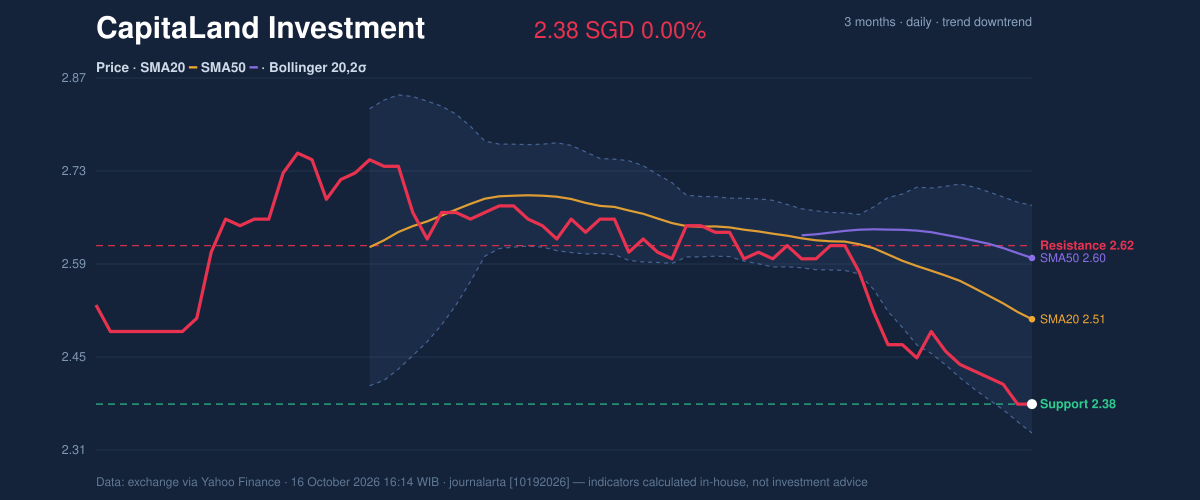
Oscillators & Momentum
Momentum indicators show how stretched the decline has become, but not that it has reversed. RSI at 24.2 is oversold, while the Stochastic readings—%K 3.7 and %D 5.1, both oversold—also place the stock near the bottom of their recent ranges. Oversold readings mean selling has been unusually strong; they can precede a rebound, but they can also persist while a downtrend continues. The MACD remains negative: -0.061, against a signal line of -0.050, with a negative histogram of -0.012. MACD compares short- and longer-term price momentum; its current readings indicate downward momentum still has the upper hand. The contrast is important: RSI and Stochastic suggest the fall is extended, while MACD offers no confirmation that buyers have regained control.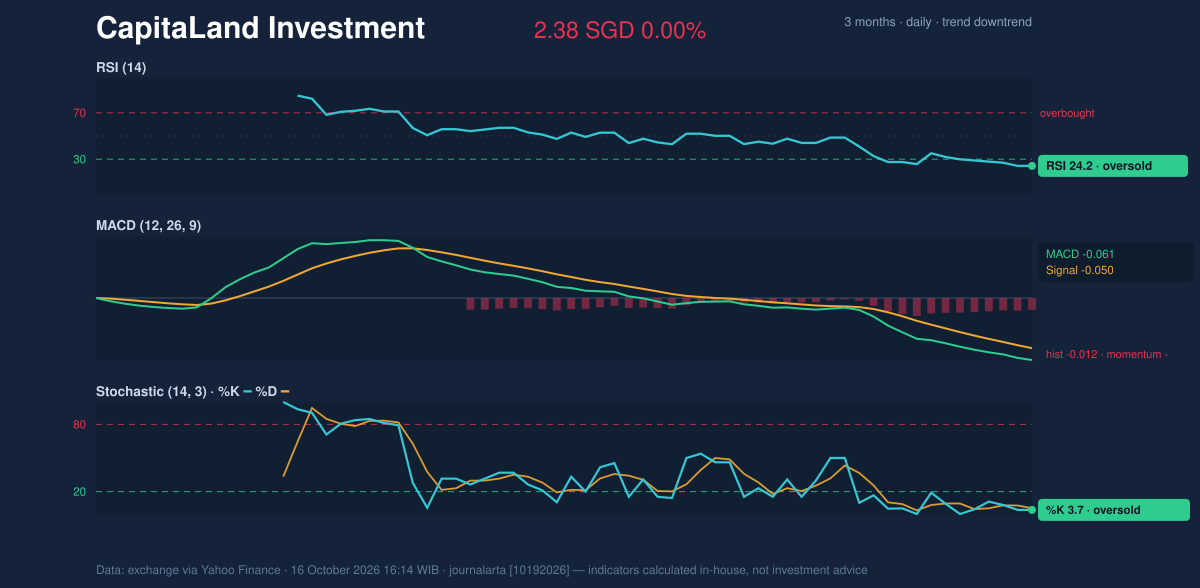
Volatility & Volume
The price is near the lower Bollinger Band, at S$2.34, with %B at 13%. Bollinger Bands track a moving average and a range around it; a low %B places the price near the bottom of that range. The band width is 13.7%, described as normal, so the data do not point to an unusually compressed setup that might signal a sharp breakout. The lower band is close to the current price, but it is not a guarantee of support. Average True Range (ATR) is S$0.05, or 2.1% of the share price, indicating moderate day-to-day volatility. Volume was 11,890,500 shares, about 1.1 times the 20-day average. That slightly above-normal activity gives the decline some participation, while falling On-Balance Volume (OBV)—a measure that accumulates volume on rising sessions and subtracts it on falling sessions—suggests buying pressure has not yet improved.Technical Verdict: HOLD (wait & see)
The indicators support a cautious, wait-and-see reading rather than a confirmed reversal. The price is below falling SMA20 and SMA50, MACD remains negative, and OBV is declining. Against that, RSI and Stochastic are oversold, and the share is close to both its 20-day support and three-month low. These conditions leave room for a rebound, but the data do not yet show momentum turning positive. - Ideal Entry Range: S$2.34–S$2.38, around the lower Bollinger Band and 20-day support. - Exit Target (Target Price): S$2.51–S$2.62, spanning SMA20 and 20-day resistance. - Stop Loss: Below S$2.34, the lower Bollinger Band. - Invalidation: The HOLD verdict is invalidated if the price falls below S$2.34. In plain English, the stock looks stretched to the downside, but its trend remains weak until the price and momentum indicators show a clearer turn. Market data: Singapore Exchange via Yahoo Finance, as of 16 October 2026, 16:14 WIB.Summary Data CapitaLand Investment
| Last price | 2.38 SGD |
| Change 1 day / 5 days / 1 month | 0.00% / -2.46% / -8.46% |
| Trend / MA-cross | downtrend / none |
| SMA20 / SMA50 | 2.51 / 2.60 |
| RSI (14) / Stochastic %K | 24.2 / 3.7 |
| Bollinger %B / ATR | 13% / 0.05 |
| Support / Resistance 20 days | 2.38 / 2.62 |
| Data as of | 16 October 2026 16:14 WIB |
Disclaimer: This technical analysis is generated automatically from exchange data (via Yahoo Finance) and indicators calculated by JournalArta, for information and education only. The verdict and the entry, target and stop-loss levels are not investment advice or a solicitation to buy or sell any security. Investment decisions and their risks rest solely with the reader.
Track CapitaLand Investment share price daily: live levels, support/resistance and our full CapitaLand Investment analysis history.