Death Cross Pressure, DBS Stock Gains 0.49% on Friday
On October 16, 2026: price 74.11 SGD, trend downtrend, RSI 38.4, support 73.36, resistance 78.56. technical analysis of dbs stock. Death Cross Pressure — full…
Trend & Price Action
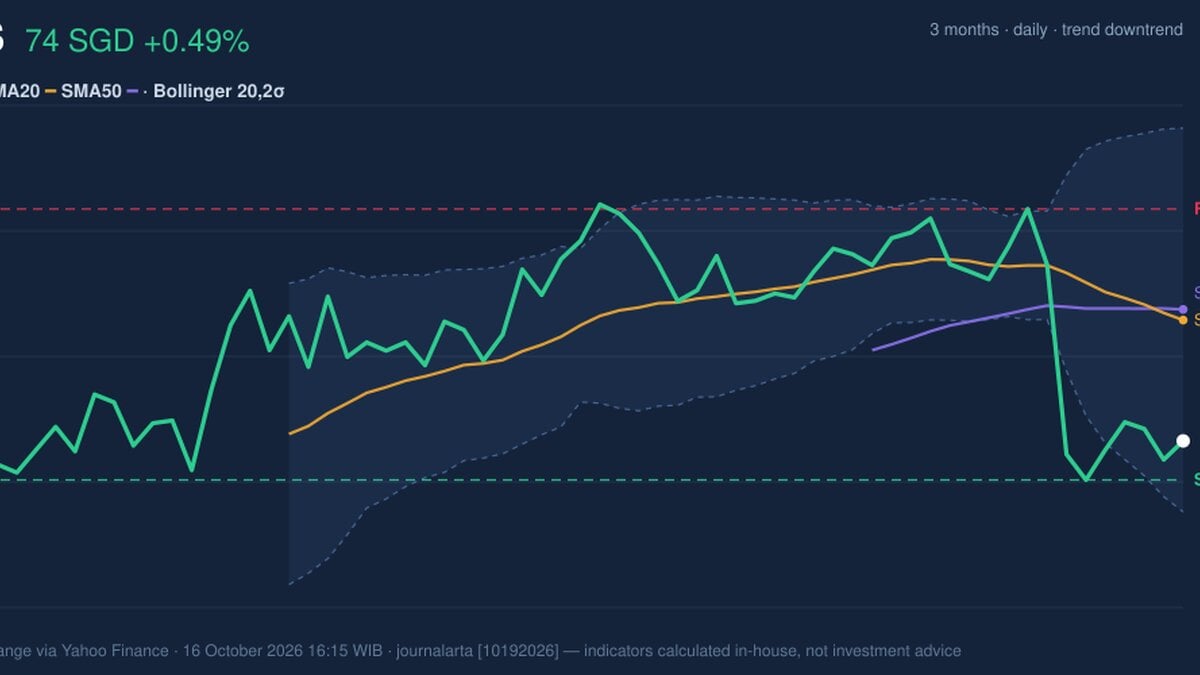
At S$74.11, DBS is below its SMA20 of S$76.43 and SMA50 of S$76.63. A death cross does not dictate what happens next, but it signals that recent price performance has deteriorated relative to the longer moving average. For the trend to look healthier, shares would need to regain those averages; until then, they may act as overhead resistance. The stock sits near the lower part of its 20-trading-day range, with support at S$73.36 and resistance at S$78.56. Its three-month range runs from S$71.37 to S$79.05, putting the current price closer to the low than the high. As shown in the chart, the price is also nearer the lower Bollinger Band than the upper one.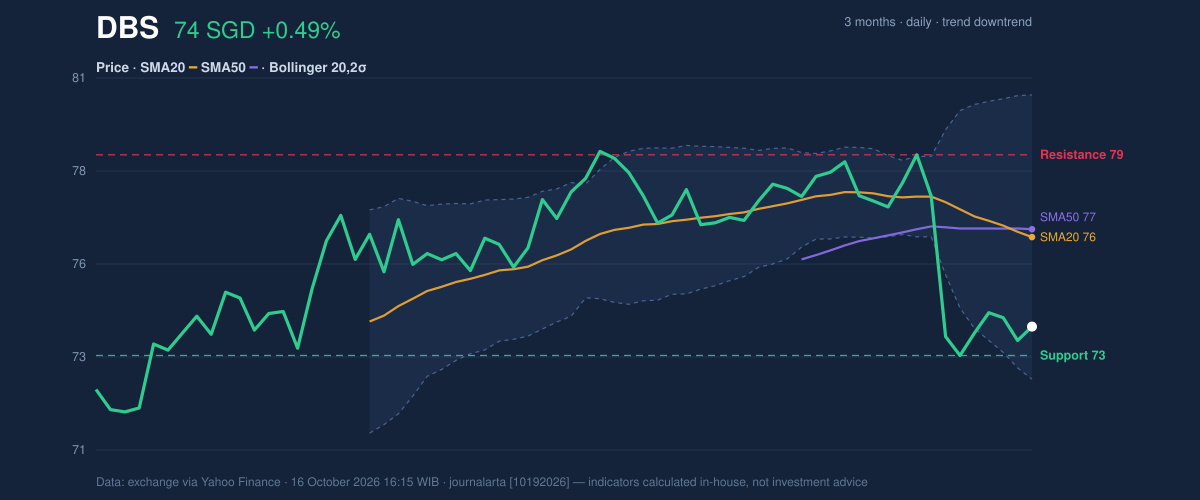
Oscillators & Momentum
Momentum indicators broadly reinforce the cautious price picture, though they do not show an extreme reading. The RSI is 38.4, a neutral reading below the midpoint that points to subdued momentum, not a decisive oversold condition. The Stochastic readings are 26.6 and 25.9, also classified as neutral in the supplied data; their proximity suggests weak momentum has not yet turned clearly upward. The MACD is negative at -0.802, below its -0.402 signal line, with a negative histogram of -0.400. MACD compares shorter- and longer-term price momentum; when it is below its signal line, it indicates that downward pressure remains stronger. That makes the recent five-day gain less convincing as a reversal signal.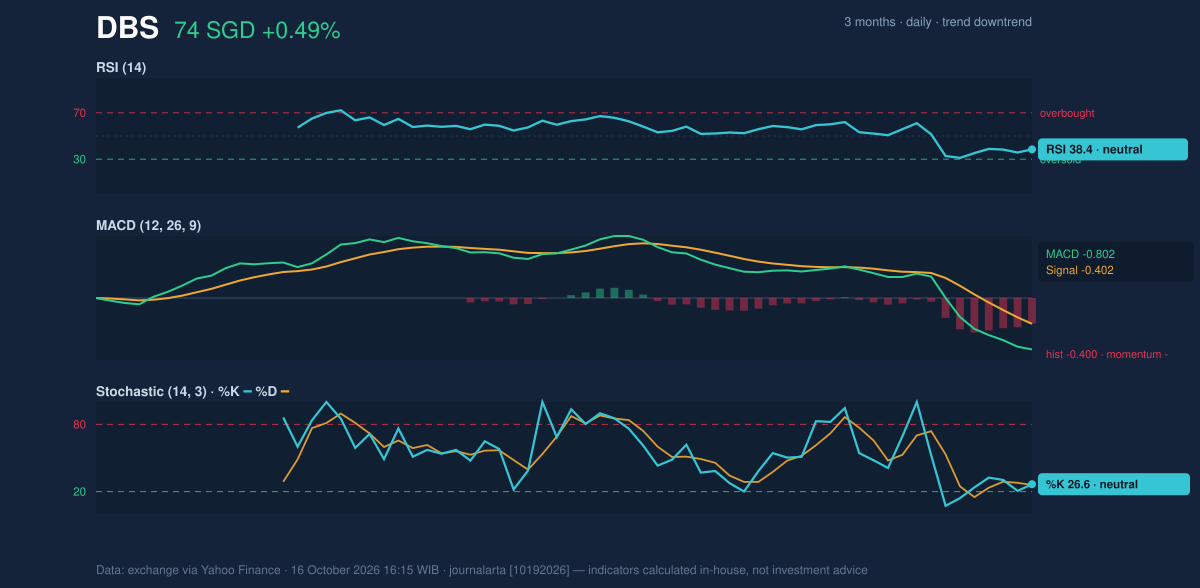
Volatility, Volume & Key Levels
The Bollinger Band reading places the shares in the lower portion of their recent volatility range: %B is 19%, with bands at S$72.75 and S$80.11. The band width of 9.6% is described as normal, not a squeeze that might signal an unusually sharp move is building. The lower band is close to the S$73.36 support, making that area an important test if selling resumes. Participation has been light. Volume was 3,796,490 shares, about 0.7 times the 20-day average of 5,441,125, while OBV was falling. OBV tracks whether volume is flowing more into rising or falling sessions; its decline suggests the recent price bounce has not been backed by stronger buying participation. ATR is S$1.24, or 1.7% of the share price, indicating moderate day-to-day volatility rather than unusually wide swings. A hold above S$73.36 would keep the near-term support intact and leave room for a test of the moving averages. A break below that support would weaken the setup and expose the broader range’s S$71.37 low. On the upside, S$76.43–S$76.63 is the first hurdle; clearing that zone would be needed before resistance at S$78.56 comes into focus.Technical Verdict: HOLD (wait & see)
The technical picture supports a HOLD (wait & see): the death cross, negative MACD and declining OBV outweigh the small daily and five-day gains, while RSI and Stochastic remain neutral rather than decisively oversold. The verdict is invalidated if price falls below S$73.36 support. - Ideal Entry Range: S$72.75–S$73.36, based on the lower Bollinger Band and 20-day support. - Exit Target (Target Price): S$76.43–S$78.56, spanning the SMA20 and 20-day resistance. - Stop Loss: Below S$72.75, the lower Bollinger Band; a break beneath it would indicate support has failed. For non-traders, the indicators say DBS has not yet shown enough strength to confirm that its recent bounce marks a lasting recovery.Data: SGX market data via Yahoo Finance, as of 16 October 2026, 16:15 WIB.
Why DBS is in focus today
- Fresh death cross: SMA20 crossed below SMA50
Selected automatically from 16 SGX (Singapore) stocks by a technical-signal score with daily weighted randomisation — not a recommendation.
Summary Data DBS
| Last price | 74.11 SGD |
| Change 1 day / 5 days / 1 month | 0.49% / 1.02% / -3.58% |
| Trend / MA-cross | downtrend / death |
| SMA20 / SMA50 | 76.43 / 76.63 |
| RSI (14) / Stochastic %K | 38.4 / 26.6 |
| Bollinger %B / ATR | 19% / 1.24 |
| Support / Resistance 20 days | 73.36 / 78.56 |
| Data as of | 16 October 2026 16:15 WIB |
Disclaimer: This technical analysis is generated automatically from exchange data (via Yahoo Finance) and indicators calculated by JournalArta, for information and education only. The verdict and the entry, target and stop-loss levels are not investment advice or a solicitation to buy or sell any security. Investment decisions and their risks rest solely with the reader.
Track DBS share price daily: live levels, support/resistance and our full DBS analysis history.