On October 19, 2026: price 247.09 USD, trend sideways, RSI 51.6, support 231.01, resistance 251.67. technical analysis of adbe stock. ADBE Stock Gains — full…
By Elena Vance
October 20, 20264 min read
ADBE Stock Gains 0.77% on Monday, Momentum Gains
Adobe rose 0.77% to $247.09 on Nasdaq, extending its five-day gain to 3.76% as the stock traded above its 20-day average but below its 50-day average. The mix points to a short-term recovery within a broader sideways pattern: momentum has improved, yet light trading volume and nearby resistance leave the move without strong confirmation.
Trend & Price Action
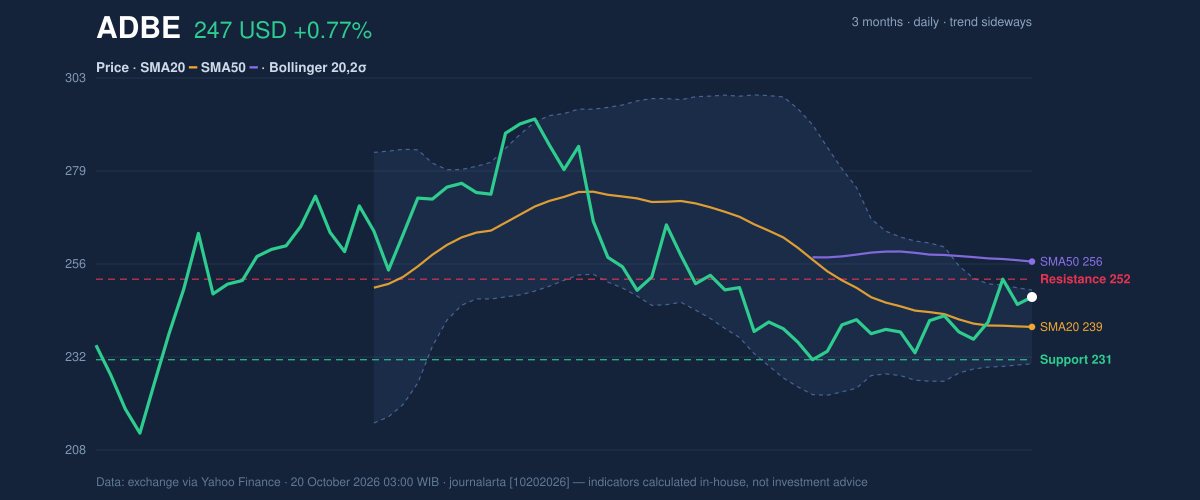
Adobe’s last price is above its SMA20, at $239.42, but remains below its SMA50 at $256.18. The 20-day average’s slope is down 0.80% over five trading days, while no new moving-average crossover has formed. That combination suggests the latest rise has not yet changed the underlying trend: buyers have lifted the stock from its short-term average, but the longer average remains overhead.
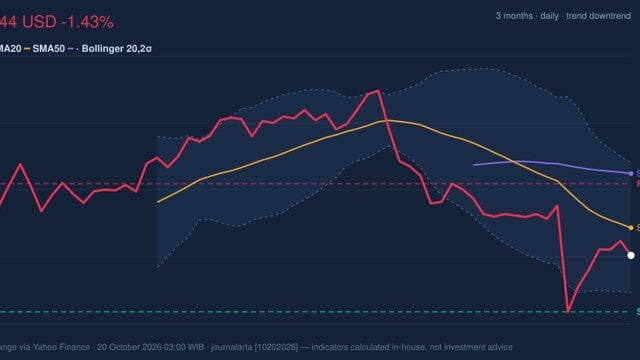
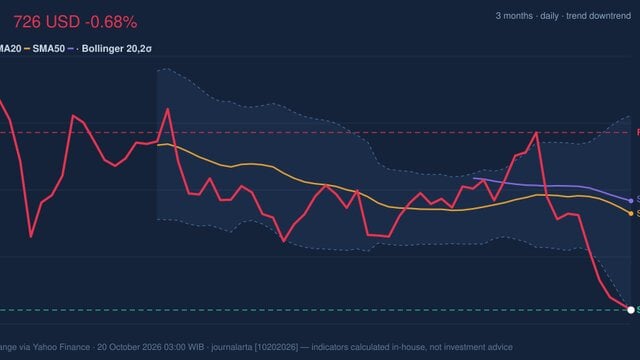
The shares are at 78% of their 20-day range, between support at $231.01 and resistance at $251.67. They are also near the upper Bollinger Band, at $248.89. As shown in the chart, this puts price close to a zone where a breakout could develop, but also where resistance may slow the advance.
3-month price action chart of ADBE: price, SMA20/50, Bollinger, support & resistance. Data: exchange via Yahoo Finance.
The squeeze matters because the Bollinger Bands have narrowed to 7.9%, indicating that recent price swings have contracted. A squeeze does not predict direction; it signals that a larger move may follow as volatility expands. With price pressing toward the upper band and resistance, a sustained move above that area would be more persuasive than a brief touch. Failure to hold above the SMA20, by contrast, would weaken the near-term recovery.
Oscillators & Momentum
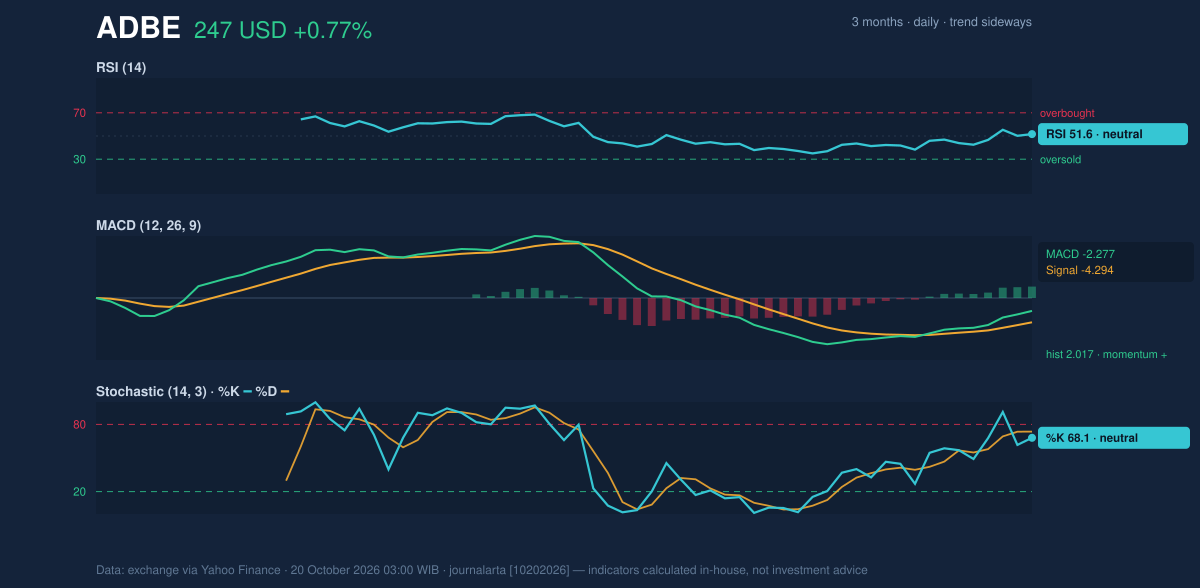
The momentum readings are constructive but not emphatic. RSI is neutral at 51.6, consistent with a market that has neither become notably overbought nor established strong upward momentum. Stochastic %K at 68.1 and %D at 73.6 is also classified as neutral; the readings do not yet provide a clear confirmation that buyers are taking control.
MACD offers the stronger bullish signal. Its line is at -2.277, above the signal line at -4.294, leaving a positive histogram of 2.017. In plain language, downward momentum has eased and the shorter-term measure is improving, even though both MACD lines remain below zero. That is a sign of recovery, not proof that the broader trend has turned upward.
Momentum chart of ADBE: RSI(14), MACD, Stochastic. Data: exchange via Yahoo Finance.
The contrast between improving MACD and neutral RSI helps explain the current technical picture: momentum is recovering, but the evidence is not strong enough to call the move decisive. A continued rise toward resistance would test whether that improvement can attract wider participation.
Volatility & Volume
Adobe’s ATR is $8.29, or 3.4% of its share price, indicating moderate day-to-day volatility. That gives context to the nearby levels: ordinary price movement can be meaningful relative to the distance between the current price and resistance, so a move through resistance would need follow-through rather than a single intraday push.
Volume is a caution. The latest session’s 2,924,300 shares were about 0.7 times the 20-day average of 4,354,755. Rising OBV, a measure that tracks whether volume tends to accompany upward or downward price moves, is supportive; however, below-average turnover means the latest advance has not been backed by typical participation. The stock’s three-month high and low—$294.53 and $210.88—also show that it remains well within a wider trading range.
Key Levels & Scenarios
The first test is $251.67 resistance, close to the SMA50 at $256.18. A sustained break above resistance would strengthen the case that the recovery is extending, while a failure there could leave Adobe moving sideways. On the downside, $239.42 at the SMA20 is the nearer reference point; a fall below it would put the $231.01 support level back in focus.
Technical Verdict: HOLD (wait & see)
The technical picture supports a neutral verdict. First, the price is above the SMA20 but below the SMA50, with no new crossover. Second, MACD momentum is positive, but RSI and Stochastic remain neutral. Third, the Bollinger squeeze raises the possibility of a larger move, while below-average volume leaves its direction unconfirmed.
The verdict is invalidated if price falls below $231.01 support.
- Ideal Entry Range: $239.42–$231.01, anchored to the SMA20 and 20-day support.
- Exit Target (Target Price): $251.67–$256.18, spanning 20-day resistance and the SMA50.
- Stop Loss: Below $231.01, the stated 20-day support level.
For non-traders, Adobe’s short-term momentum is improving, but the price has not yet cleared the levels that would confirm a stronger trend.
Indicator
Reading
Last price
$247.09
Daily / five-day change
+0.77% / +3.76%
SMA20 / SMA50
$239.42 / $256.18
RSI / Stochastic
51.6 / %K 68.1, %D 73.6
MACD / signal / histogram
-2.277 / -4.294 / 2.017
20-day support / resistance
$231.01 / $251.67
ATR
$8.29 (3.4%)
Volume / 20-day average
2,924,300 / 4,354,755
Summary Data ADBE
Last price
247.09 USD
Change 1 day / 5 days / 1 month
0.77% / 3.76% / -0.97%
Trend / MA-cross
sideways / none
SMA20 / SMA50
239.42 / 256.18
RSI (14) / Stochastic %K
51.6 / 68.1
Bollinger %B / ATR
90% / 8.29
Support / Resistance 20 days
231.01 / 251.67
Data as of
20 October 2026 03:00 WIB
Disclaimer: This technical analysis is generated automatically from exchange data (via Yahoo Finance) and indicators calculated by JournalArta, for information and education only. The verdict and the entry, target and stop-loss levels are not investment advice or a solicitation to buy or sell any security. Investment decisions and their risks rest solely with the reader.