Testing Key Resistance, AAPL Stock Drops 0.15% on Monday
On October 19, 2026: price 342.94 USD, trend uptrend, RSI 60.8, support 329.40, resistance 343.46. technical analysis of aapl stock. Testing Key Resistance —…
Trend & Price Action
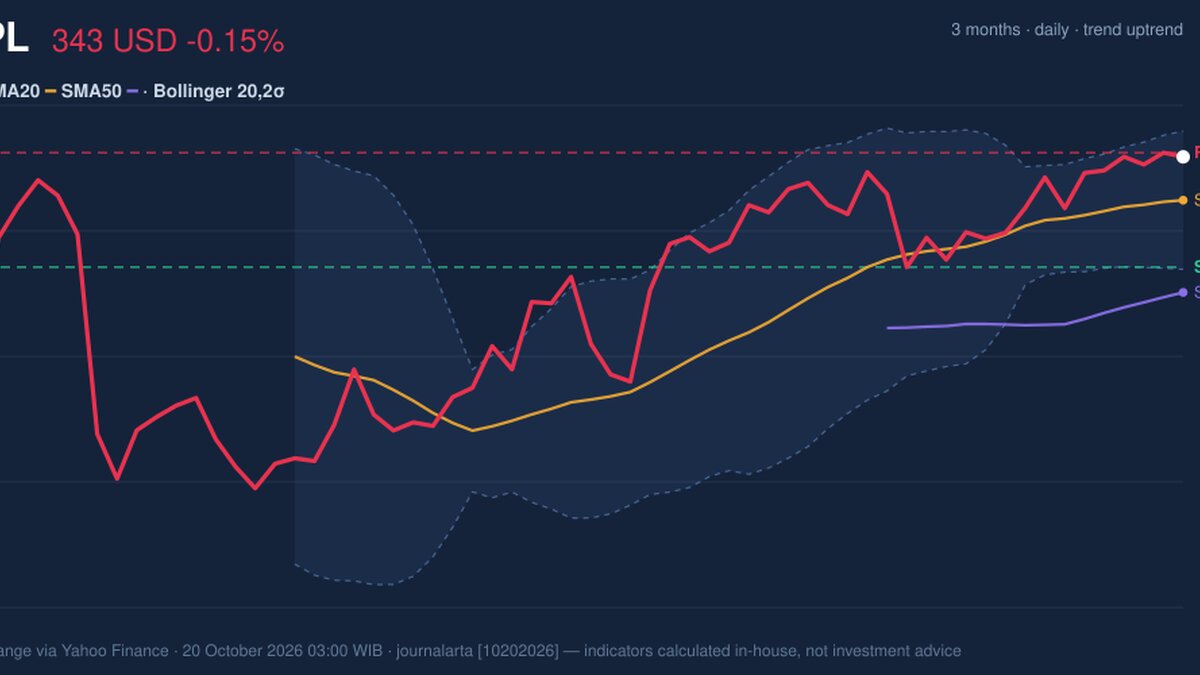
The trend structure is constructive. Apple trades above its 20-day simple moving average, or SMA20, at $337.62, and its 50-day average at $326.29. A simple moving average tracks the average closing price over a set period; the current positioning indicates that recent prices are stronger than those averages. The SMA20 is also rising, up 0.55% over five trading days. There has been no new crossover between the averages, so the signal comes from price staying above them rather than a fresh technical trigger. The three-month range runs from $300.00 to $348.15. Near that upper boundary, the key question is whether buyers can sustain the advance or whether resistance checks it. As shown in the chart, the Bollinger bands place the upper boundary at $346.11, the middle line at $337.62 and the lower boundary at $329.13. Bollinger bands show how far price is moving from its recent average; the current 81% position within the bands puts the share closer to the upper edge, but not beyond it. The bands are narrowing, a squeeze that can precede a larger move without indicating its direction.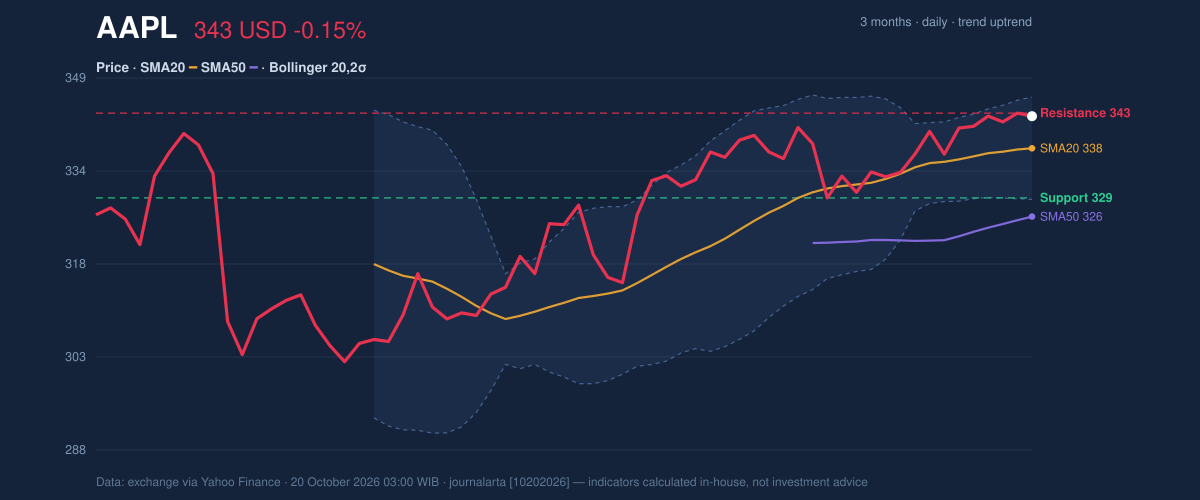
Oscillators & Momentum
Momentum indicators lean positive, though they do not show an extreme reading. The RSI is 60.8, a neutral reading; the Relative Strength Index measures the pace of recent gains and losses, with higher readings generally pointing to stronger momentum. The Stochastic oscillator, which compares a closing price with its recent trading range, is also labeled neutral, with %K at 76.7 and %D at 76.1. Their closeness suggests the recent momentum readings are broadly aligned rather than sharply diverging. The MACD is positive at 4.004 versus a 3.798 signal line, with a positive 0.206 histogram. MACD compares moving averages to gauge trend momentum; a positive histogram means the MACD remains above its signal line. Together, these measures support the uptrend, but do not remove the risk of a pause near resistance.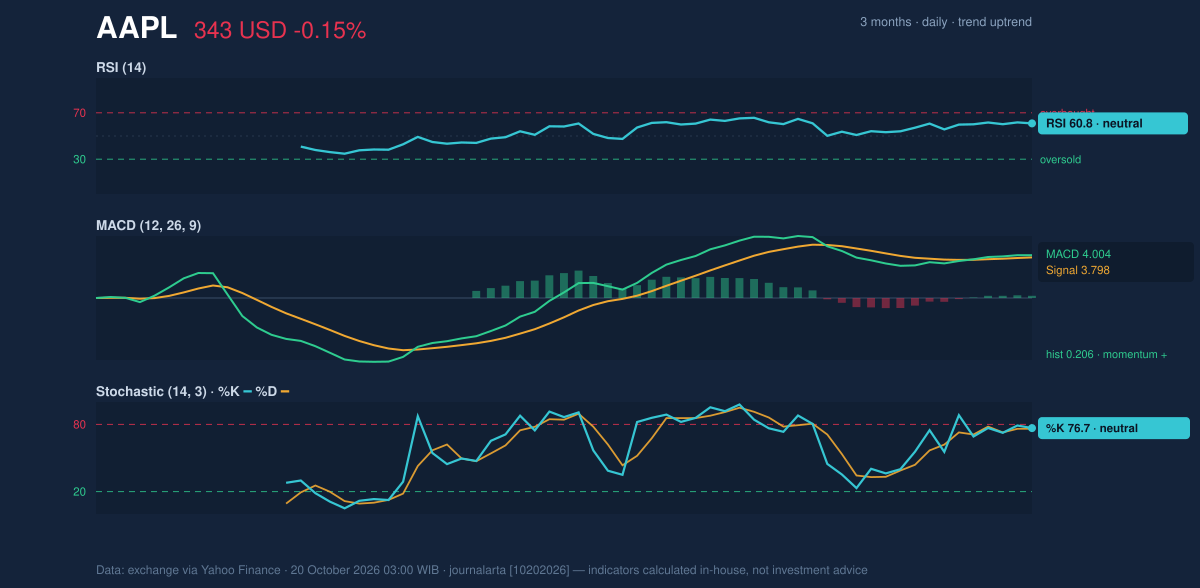
Volatility & Volume
The 14-day Average True Range, a measure of typical daily price movement, is $6.42, or 1.9% of the share price—consistent with moderate volatility in the supplied data. A narrowing Bollinger squeeze means the recent trading band has contracted; it points to reduced movement so far, not a guaranteed breakout. Volume was 34,547,800 shares, about 0.9 times the 20-day average of 36,969,845. That is slightly below normal participation, while On-Balance Volume, which accumulates volume on rising days and subtracts it on falling days, is rising. The combination is supportive but not forceful: the price advance has not yet been matched by above-average turnover.Key Levels & Scenarios
The $343.46 resistance is the immediate test, with the three-month high at $348.15 beyond it. A sustained move through resistance would put that high in focus, though the narrowing bands leave the direction of any expansion unresolved. If the price fails there, the SMA20 at $337.62 is the first reference point; below it, the lower Bollinger boundary at $329.13 sits close to the 20-day support at $329.40.Technical Verdict: HOLD (wait & see)
The technical evidence supports a neutral stance pending confirmation. The price remains above both moving averages and the rising SMA20, while MACD is positive and OBV is climbing. Against that, the share is near resistance, trading volume is below its 20-day norm, and the Bollinger squeeze does not reveal which way the next larger move will go. The verdict is invalidated if the price falls below $329.40 support. - Ideal Entry Range: $337.62–$329.40, bounded by the SMA20 and 20-day support. - Exit Target (Target Price): $343.46–$348.15, from 20-day resistance to the three-month high. - Stop Loss: $329.13, at the lower Bollinger band. For non-traders, the indicators show an upward bias, but the price is close to resistance and has not yet confirmed a decisive break.Market data: exchange data via Yahoo Finance, as of 03:00 WIB on 20 October 2026. Technical analysis only; not an investment recommendation.
Why AAPL is in focus today
- Trading near its 3-month high (348.15)
Selected automatically from 32 NASDAQ (US) stocks by a technical-signal score with daily weighted randomisation — not a recommendation.
Summary Data AAPL
| Last price | 342.94 USD |
| Change 1 day / 5 days / 1 month | -0.15% / 0.58% / 1.17% |
| Trend / MA-cross | uptrend / none |
| SMA20 / SMA50 | 337.62 / 326.29 |
| RSI (14) / Stochastic %K | 60.8 / 76.7 |
| Bollinger %B / ATR | 81% / 6.42 |
| Support / Resistance 20 days | 329.40 / 343.46 |
| Data as of | 20 October 2026 03:00 WIB |
Disclaimer: This technical analysis is generated automatically from exchange data (via Yahoo Finance) and indicators calculated by JournalArta, for information and education only. The verdict and the entry, target and stop-loss levels are not investment advice or a solicitation to buy or sell any security. Investment decisions and their risks rest solely with the reader.
Track AAPL stock price daily: live levels, support/resistance and our full AAPL analysis history.