TMUS Momentum Gains: Stock Drops 1.89% (October 19, 2026)
On October 19, 2026: price 156.09 USD, trend downtrend, RSI 40.1, support 148.58, resistance 171.31. technical analysis of tmus stock. TMUS Momentum Gains —…
Why TMUS is in focus today
- MACD histogram has just turned positive
Selected automatically from 32 NASDAQ (US) stocks by a technical-signal score with daily weighted randomisation — not a recommendation.
Trend & Price Action
The shares trade below both the 20-day simple moving average (SMA), at $161.52, and the 50-day SMA, at $172.41. A moving average smooths past prices to show the prevailing direction; here, the lower price and falling 20-day average point to persistent selling pressure. There has been no recent crossover between the averages, so the data does not yet signal a confirmed change in trend. The stock sits at 33% of its 20-trading-day range, between support at $148.58 and resistance at $171.31. Support is a zone where demand has previously helped limit declines; resistance is where selling has tended to emerge. The three-month low of $147.90 is close to the support level, making that area a meaningful test if the price retreats. As shown in the chart, the price remains below its moving averages and in the lower portion of the recent range.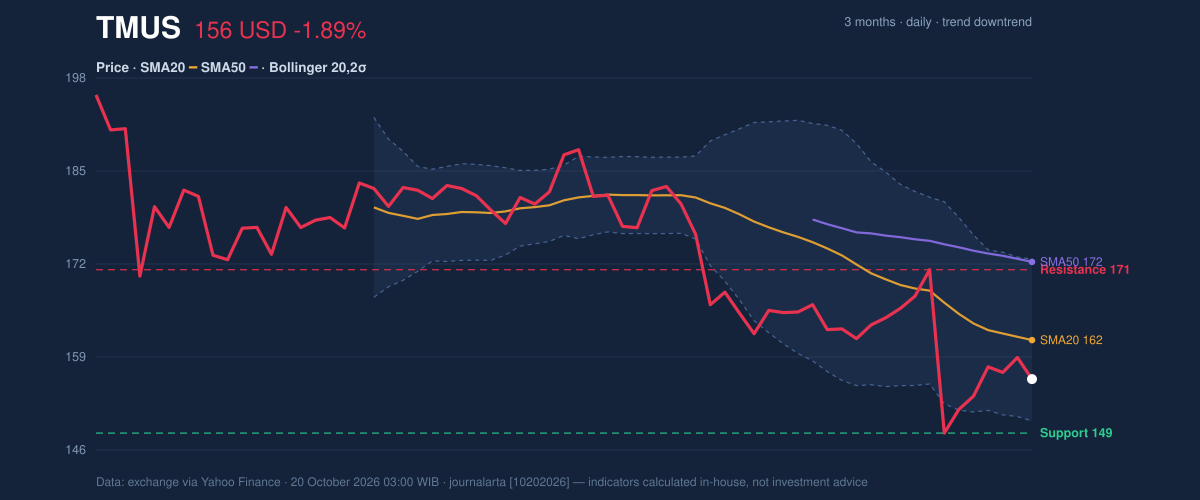
Oscillators & Momentum
The momentum readings are mixed, not decisively bearish or bullish. RSI, a gauge of the speed and size of recent price moves, is 40.1 and neutral; it shows weakness but is not in the conventional oversold zone. The Stochastic readings are also neutral, with %K at 34.3 and %D at 39.8. Because %K is below %D, the short-term reading has not yet confirmed a stronger upward turn. The more notable change is in MACD, a measure comparing faster and slower price averages. Its value is -4.744 and its signal line is -4.756, while the histogram is slightly positive at 0.012. That means the faster measure has edged above its signal line, suggesting selling momentum may be easing. But both MACD lines remain below zero, so this is an early improvement within a weak broader structure—not confirmation of a reversal.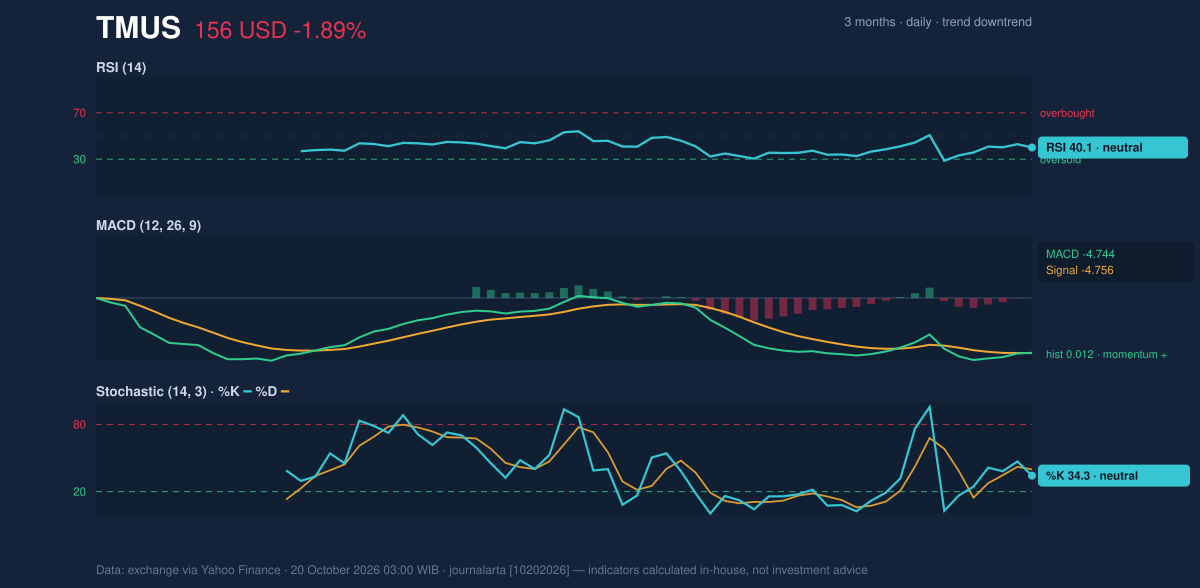
Volatility & Trading Activity
Average True Range (ATR), a measure of typical price movement, is $5.27, or 3.4% of the share price. That points to moderate volatility: daily swings can be material, but the indicator does not describe an unusually turbulent market. Volume was 5,182,500 shares, about 0.9 times its 20-day average of 5,938,365. The latest decline therefore did not come with above-average trading activity. At the same time, rising On-Balance Volume (OBV)—a running measure that adds or subtracts volume based on the direction of price changes—suggests participation has not uniformly deteriorated. That divergence offers some support to the possibility of stabilization, but it does not outweigh the price’s position below the SMAs.Key Levels & Scenarios
A sustained move back above the 20-day SMA at $161.52 would be an initial sign that the short-term slide is losing force; the higher resistance at $171.31 remains a more substantial hurdle. If the price fails to hold near $148.58, the three-month low of $147.90 becomes the next nearby reference point in the supplied data. A break below that support would invalidate a cautious stabilization case.Technical Verdict: HOLD (wait & see)
The technical picture supports HOLD (wait & see): MACD momentum has just turned positive and OBV is rising, but the downtrend, falling SMA20 and price below both moving averages argue against treating that shift as a confirmed reversal. RSI and Stochastic remain neutral, while the stock is still in the lower part of its Bollinger range. - Ideal Entry Range: $150.26–$161.52, bounded by the lower Bollinger Band and SMA20. - Exit Target: $171.31, the 20-trading-day resistance. - Stop Loss: Below $148.58, the 20-trading-day support. - Invalidation: The cautious stabilization case is invalidated if the price falls below $148.58. For non-traders, this means the shares show an early hint of improving momentum, but the broader price trend has not yet turned upward.| Metric | Reading |
|---|---|
| Last price | $156.09 |
| SMA20 / SMA50 | $161.52 / $172.41 |
| RSI / Stochastic | 40.1 / %K 34.3, %D 39.8 |
| MACD histogram | 0.012, positive |
| Support / resistance | $148.58 / $171.31 |
| Source | Exchange data via Yahoo Finance, as of October 20, 2026, 03:00 WIB |
Summary Data TMUS
| Last price | 156.09 USD |
| Change 1 day / 5 days / 1 month | -1.89% / 2.78% / -5.55% |
| Trend / MA-cross | downtrend / none |
| SMA20 / SMA50 | 161.52 / 172.41 |
| RSI (14) / Stochastic %K | 40.1 / 34.3 |
| Bollinger %B / ATR | 26% / 5.27 |
| Support / Resistance 20 days | 148.58 / 171.31 |
| Data as of | 20 October 2026 03:00 WIB |
Disclaimer: This technical analysis is generated automatically from exchange data (via Yahoo Finance) and indicators calculated by JournalArta, for information and education only. The verdict and the entry, target and stop-loss levels are not investment advice or a solicitation to buy or sell any security. Investment decisions and their risks rest solely with the reader.
Track TMUS stock price daily: live levels, support/resistance and our full TMUS analysis history.