AMD Stock Drops 0.62%, Testing Support Level In Focus
On October 20, 2026: price 534.74 USD, trend sideways, RSI 39.6, support 528.75, resistance 649.42. technical analysis of amd stock. AMD Stock Drops — full…
By Alistair Sterling
October 21, 20264 min read
AMD Stock Drops 0.62%, Testing Support Level In Focus
AMD’s decline puts a key support level in view for investors tracking the US chipmaker and the wider semiconductor sector: the stock ended at $534.74, down 0.62% on the day and 11.69% over five trading days, close to its 20-day support of $528.75.
The move reflects more than a weak session. AMD is down 14.27% over one month, and its price sits below both its 20-day average and the 50-day average. Those measures track recent trading prices and help show whether a stock is holding its short-term direction. For AMD, they point to a market under pressure, even as some momentum readings suggest selling may be stretched.
Trend & Price Action
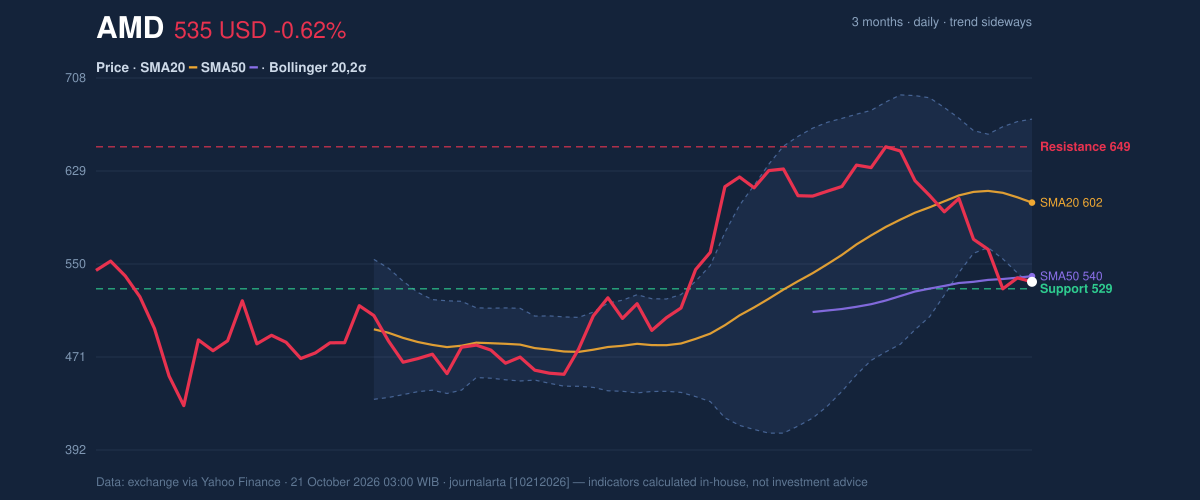
AMD’s last price is well below its 20-day simple moving average (SMA) of $602.08 and just under its 50-day SMA of $539.54. The 20-day average has fallen 1.00% over five days, reinforcing the downward pressure. There has been no new crossover between the two averages, so the data do not show a fresh technical shift; instead, they show a falling short-term trend and a price struggling to reclaim its longer reference point.
The stock is near the lower edge of its recent range. Its 20-trading-day support stands at $528.75, while resistance is $649.42. AMD is also closer to its three-month low of $424.03 than its three-month high of $658.52. That positioning matters because a support test can reveal whether investors are willing to step in after a sharp decline—or whether selling is still setting the tone.
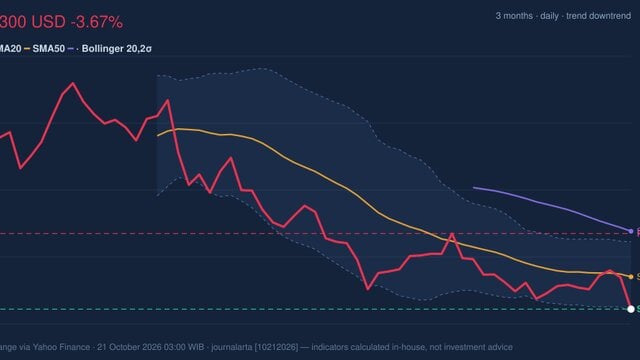
As shown in the chart, the price is hovering just above the lower Bollinger Band, a measure of how far trading has moved from its recent average.
3-month price action chart of AMD: price, SMA20/50, Bollinger, support & resistance. Data: exchange via Yahoo Finance.
Oscillators & Momentum
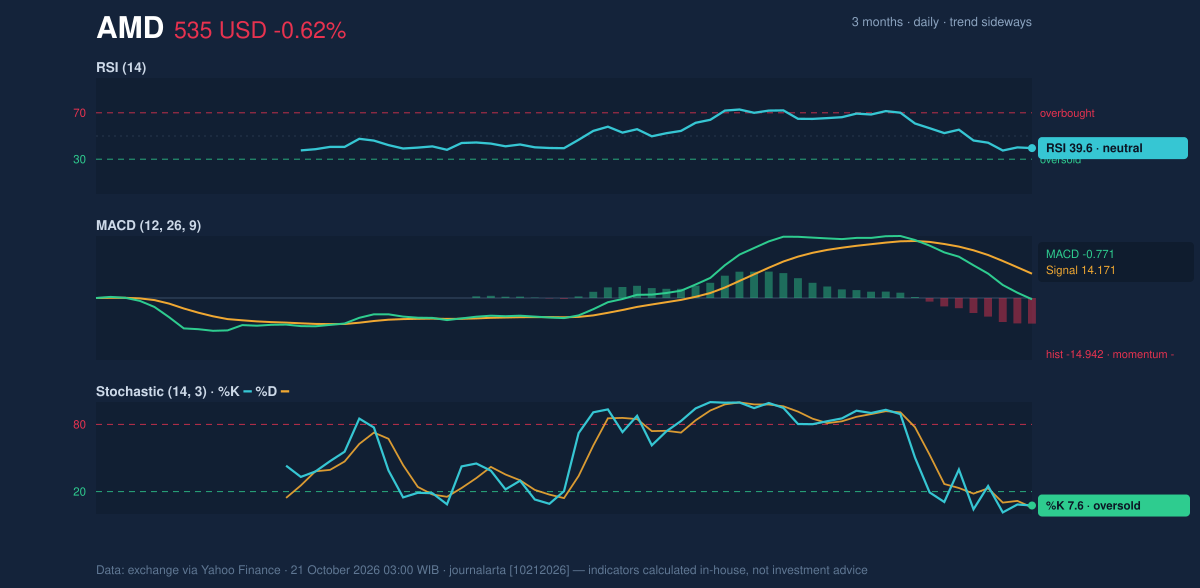
The indicators are mixed, but the balance remains cautious. The RSI is 39.6, a neutral reading that is below the midpoint of its scale but not, by itself, a clear signal of an extreme move. By contrast, the Stochastic readings of 7.6 and 5.8 are oversold. That means recent prices have been near the lower end of their short-term range; it can precede a bounce, but it does not confirm one.
The MACD is negative, with a reading of -0.771 against a signal line of 14.171 and a histogram of -14.942. MACD compares short- and longer-term price momentum. Here, its negative histogram indicates that downside momentum remains dominant, even as the Stochastic suggests the decline may have become stretched.
The chart puts those signals side by side: oversold readings can flag pressure that has gone far, while the negative MACD shows that a sustained reversal has not yet been established.
Momentum chart of AMD: RSI(14), MACD, Stochastic. Data: exchange via Yahoo Finance.
Volatility & Volume
The Bollinger Band position is notably weak: %B is 3%, placing the stock close to the lower band at $531.17. The bands are 23.6% wide and widening, a sign that price swings have grown rather than settled. The average true range, which estimates typical daily movement, is $27.36, or 5.1% of the share price. For investors, that means support tests and rebounds may both come with sizeable moves.
Trading participation offers little confirmation of a rebound so far. Volume was 15.0 million shares, about 0.8 times the 20-day average of 19.4 million, while on-balance volume—which tracks whether volume accompanies rising or falling prices—has declined. The combination suggests selling pressure, but not a surge in trading activity that would clearly mark a decisive capitulation.
Technical Verdict: HOLD
HOLD (wait & see) is the clearest technical reading of the current mix. AMD is near support and oversold on the Stochastic, but it remains below both moving averages, MACD momentum is negative, and the Bollinger Bands and ATR point to elevated volatility. A break below $528.75 would invalidate this wait-and-see view by putting the identified support under pressure.
- Ideal entry range: $528.75–$539.54, bounded by 20-day support and the 50-day SMA.
- Exit target: $602.08, the 20-day SMA and a potential recovery level; the next resistance is $649.42.
- Stop-loss protection: Below $528.75, the stated support level.
In plain English, AMD is near a potential floor, but the indicators have not yet shown that buyers are taking control.
Metric
Reading
Last price
$534.74
Daily / five-day / one-month change
-0.62% / -11.69% / -14.27%
SMA20 / SMA50
$602.08 / $539.54
Support / resistance (20 trading days)
$528.75 / $649.42
RSI / Stochastic
39.6 / oversold
MACD histogram
-14.942
ATR / volume vs. 20-day average
$27.36 (5.1%) / 0.8×
Summary Data AMD
Last price
534.74 USD
Change 1 day / 5 days / 1 month
-0.62% / -11.69% / -14.27%
Trend / MA-cross
sideways / none
SMA20 / SMA50
602.08 / 539.54
RSI (14) / Stochastic %K
39.6 / 7.6
Bollinger %B / ATR
3% / 27.36
Support / Resistance 20 days
528.75 / 649.42
Data as of
21 October 2026 03:00 WIB
Disclaimer: This technical analysis is generated automatically from exchange data (via Yahoo Finance) and indicators calculated by JournalArta, for information and education only. The verdict and the entry, target and stop-loss levels are not investment advice or a solicitation to buy or sell any security. Investment decisions and their risks rest solely with the reader.