AMZN Stock Gains 0.07%, Testing Key Resistance In Focus
On October 20, 2026: price 262.63 USD, trend sideways, RSI 57.5, support 246.15, resistance 262.63. technical analysis of amzn stock. AMZN Stock Gains — full…
By Alistair Sterling
October 21, 20264 min read
AMZN Stock Gains 0.07%, Testing Key Resistance In Focus
Amazon shares rose 0.07% to $262.63 on Nasdaq, according to market data from Yahoo Finance at 03:00 WIB on Oct. 21, 2026, putting the stock at the top of its recent trading range. The move was modest. But its position near resistance, alongside positive MACD momentum and an overbought Stochastic reading, puts the focus on whether buyers can sustain the advance or the stock will pause.
Trend & Price Action
AMZN has gained 1.57% over five trading days and 3.00% over one month, while its broader trend remains sideways. The shares trade above the 20-day simple moving average (SMA) of $253.81, and that average has edged higher by 0.39% over five days. However, the 50-day SMA at $256.53 sits above the 20-day line, with no new moving-average crossover. That combination suggests short-term improvement, but not a confirmed shift into a stronger trend.
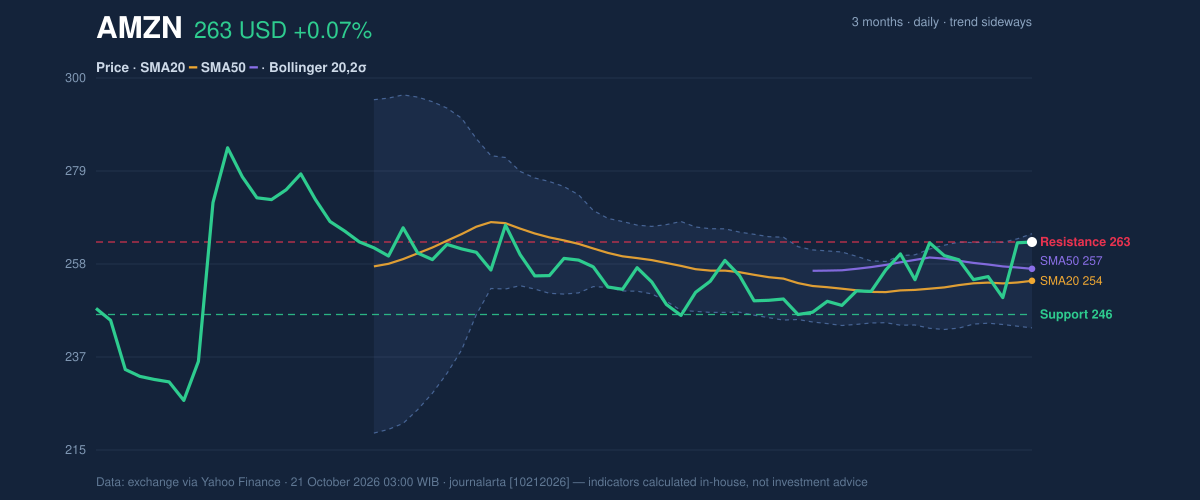
The price is at 100% of its 20-trading-day range, with resistance at $262.63 and support at $246.15. It remains below the three-month high of $287.20 and above the three-month low of $226.16. In practical terms, AMZN has recovered within its broader range but is testing a near-term ceiling rather than breaking out of its larger trading structure.
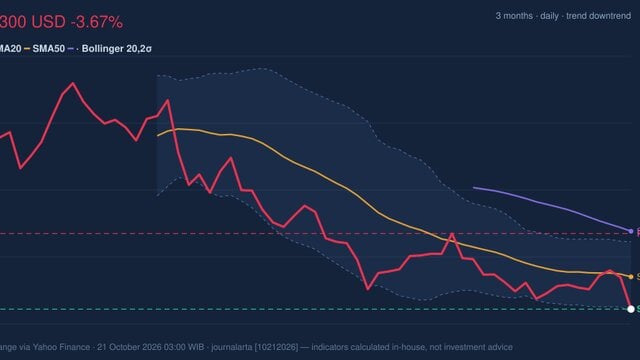
As shown in the chart, the share price is close to the upper Bollinger Band at $264.51. Bollinger Bands measure how far a price moves from its recent average; the band’s normal width of 8.4% does not indicate an unusually tight setup or a major volatility expansion.
3-month price action chart of AMZN: price, SMA20/50, Bollinger, support & resistance. Data: exchange via Yahoo Finance.
Oscillators & Momentum
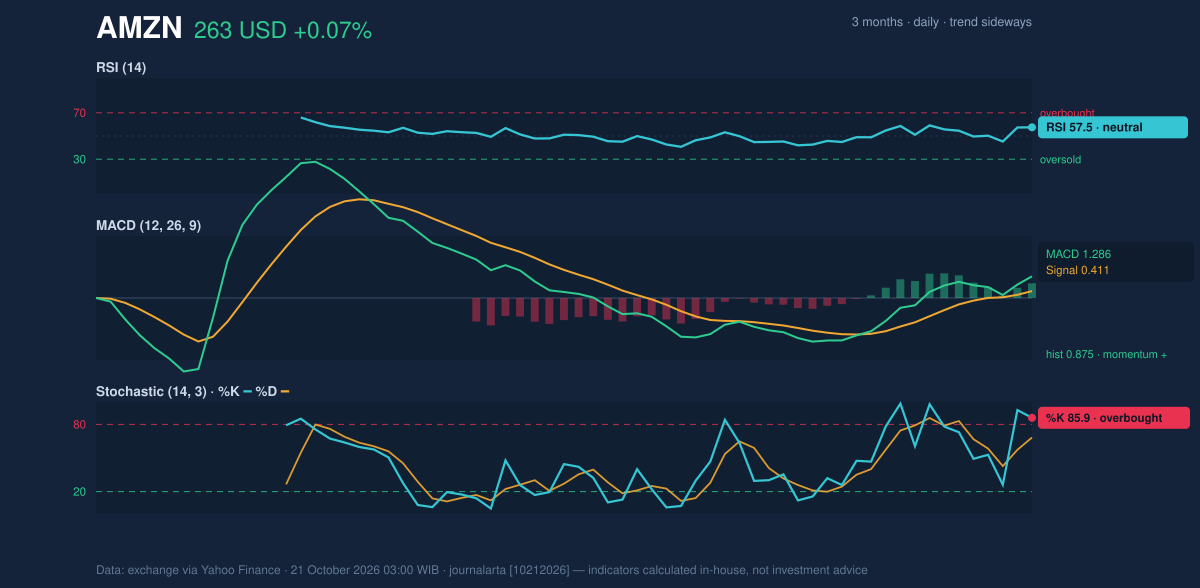
Momentum indicators are positive, but they are not all pointing to the same degree of strength. The RSI is neutral at 57.5, suggesting the shares have room to move in either direction without being at an extreme on that measure. The Stochastic %K at 85.9 is above its %D at 68.3, with %K in overbought territory. This can signal that recent gains have been rapid and that the price may be vulnerable to a pause; it does not, on its own, establish that a reversal has begun.
The MACD is positive at 1.286, above its 0.411 signal line, with a positive 0.875 histogram. MACD compares shorter- and longer-term price momentum; its positive reading supports the case that upward momentum is still present. The key tension is that MACD points higher while Stochastic warns the advance may be stretched.
Momentum chart of AMZN: RSI(14), MACD, Stochastic. Data: exchange via Yahoo Finance.
Volatility & Volume
The 14-day average true range (ATR), a measure of typical daily price movement, is $6.52, or 2.5% of the share price. That indicates moderate volatility: daily swings remain meaningful, but the data do not show an unusually turbulent market. With price at 91% of the range between the Bollinger Bands, the shares are also trading near the upper side of their recent distribution.
Volume was 34,767,800 shares, close to the 20-day average of 36,105,880, or 1.0 times normal activity. On-balance volume (OBV), which tracks whether volume is more associated with rising or falling sessions, is increasing. That offers some confirmation that participation has been constructive, though normal—not exceptional—volume leaves the test of resistance unresolved.
Key Levels & Scenarios
The immediate test is whether AMZN can hold above the $262.63 resistance area; a sustained break would put attention on the upper Bollinger Band at $264.51. If the price fails to hold its current area, the 50-day SMA at $256.53 and 20-day SMA at $253.81 are nearer reference points, followed by 20-day support at $246.15. A fall below that support would weaken the short-term technical picture.
Technical Verdict: HOLD (wait & see)
Core technical conclusion: HOLD (wait & see), as positive MACD and rising OBV are counterbalanced by resistance at the top of the recent range and an overbought Stochastic reading.
The verdict is supported by three signals: MACD remains above its signal line; OBV is rising on roughly normal volume; and the share price is at resistance while Stochastic is overbought. The verdict is invalidated if price falls below $246.15, the 20-day support level.
Ideal entry range: $253.81–$256.53, around the 20-day and 50-day SMAs.
Exit target: $264.51, the upper Bollinger Band.
Stop-loss protection: $246.15, the 20-day support level.
For non-traders, the indicators show improving momentum, but the share price is already pressing against a nearby ceiling.
Measure
Reading
Last price
$262.63
1-day / 5-day / 1-month change
+0.07% / +1.57% / +3.00%
SMA20 / SMA50
$253.81 / $256.53
RSI(14)
57.5, neutral
Stochastic %K / %D
85.9 / 68.3
MACD / signal / histogram
1.286 / 0.411 / 0.875
ATR(14)
$6.52
20-day support / resistance
$246.15 / $262.63
Upper Bollinger Band
$264.51
Volume / 20-day average
34,767,800 / 36,105,880
Summary Data AMZN
Last price
262.63 USD
Change 1 day / 5 days / 1 month
0.07% / 1.57% / 3.00%
Trend / MA-cross
sideways / none
SMA20 / SMA50
253.81 / 256.53
RSI (14) / Stochastic %K
57.5 / 85.9
Bollinger %B / ATR
91% / 6.52
Support / Resistance 20 days
246.15 / 262.63
Data as of
21 October 2026 03:00 WIB
Disclaimer: This technical analysis is generated automatically from exchange data (via Yahoo Finance) and indicators calculated by JournalArta, for information and education only. The verdict and the entry, target and stop-loss levels are not investment advice or a solicitation to buy or sell any security. Investment decisions and their risks rest solely with the reader.