INTU Stock Technicals: Gains 2.97% on Tuesday, Testing Key Resistance
On October 20, 2026: price 335.29 USD, trend sideways, RSI 65.3, support 268.03, resistance 335.29. technical analysis of intu stock. INTU Stock Technicals —…
By Alistair Sterling
October 21, 20264 min read
INTU Stock Technicals
Intuit rose 2.97% to $335.29 on Oct. 20, extending a five-day gain of 11.23% and a one-month advance of 14.69%, according to market data from Yahoo Finance. The move has carried the stock to the top of its 20-trading-day range, where positive momentum is meeting near-term exhaustion signals.
The advance is strong. Its confirmation is mixed.
Trend & Price Action
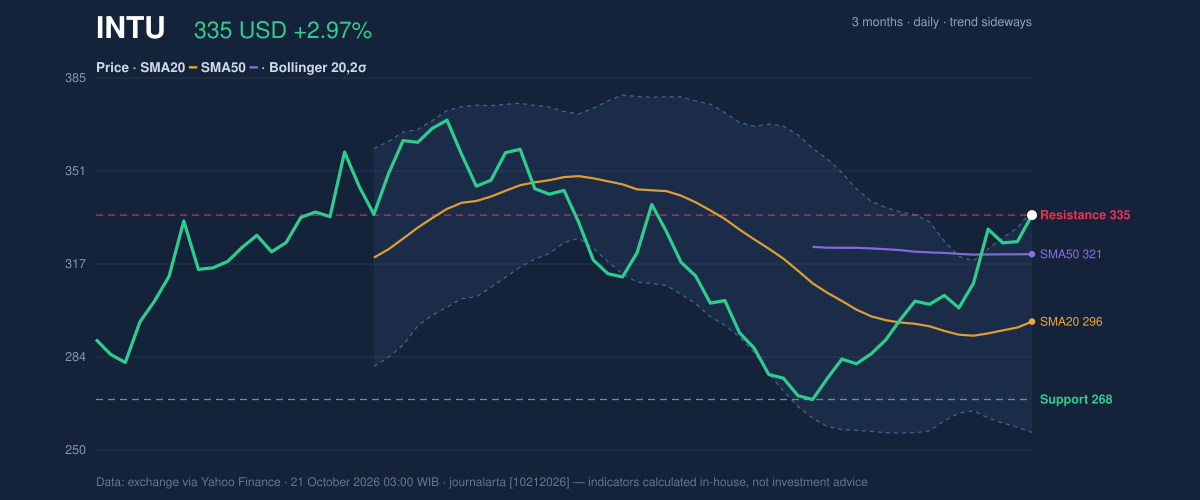
Intuit’s share price is above its 20-day simple moving average (SMA) of $296.46, while the SMA20 has risen 1.64% over five trading days. It is also above the 50-day SMA of $321.03, a constructive price structure, though no new moving-average crossover has occurred. That distinction matters: the price trend has improved, but the data do not show a fresh crossover signal that would independently confirm a longer-term shift.
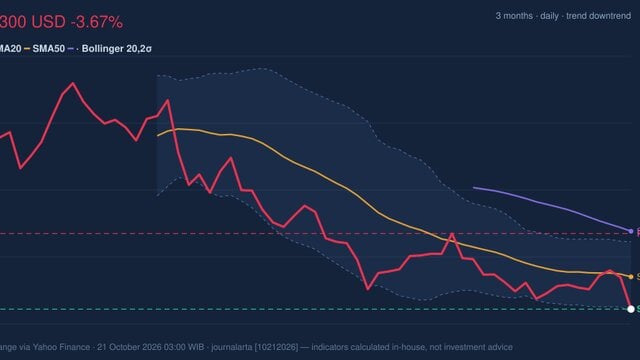
The stock is at 100% of its 20-day range, with $335.29 marked as resistance. Its three-month high is $372.98, leaving room above the current level but not removing the immediate hurdle. As shown in the chart, price is pressing the upper boundary while the short-term average continues to slope upward.
3-month price action chart of INTU: price, SMA20/50, Bollinger, support & resistance. Data: exchange via Yahoo Finance.
Oscillators & Momentum
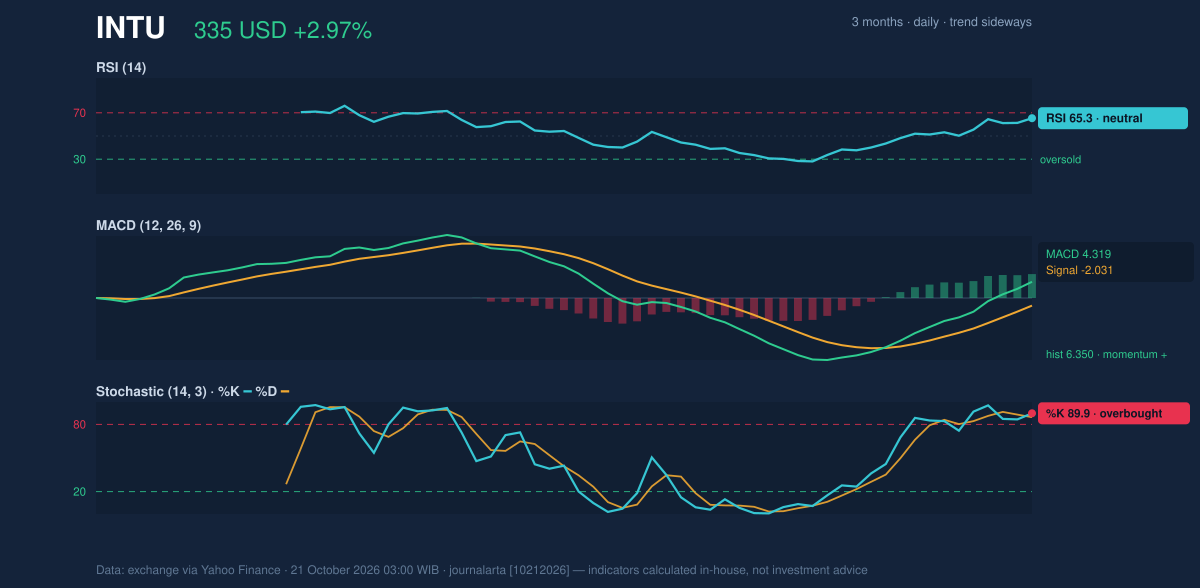
The momentum indicators point in different directions. The RSI, or Relative Strength Index, is 65.3 and classified as neutral. That reading suggests firm buying pressure without the RSI itself signaling an overbought condition.
The Stochastic oscillator is more stretched: %K is 89.9 and %D is 86.4, both in overbought territory. This does not establish that a reversal is underway, but it means recent gains may be vulnerable to a pause or pullback if buyers do not keep pushing through resistance.
MACD, a measure of trend momentum, is positive at 4.319, above its signal line at -2.031, with a positive histogram of 6.350. Positive MACD momentum supports the advance, but the overbought Stochastic warns that the move is running hot. The chart makes that divergence easier to see: momentum remains constructive even as the Stochastic approaches an extreme.
Momentum chart of INTU: RSI(14), MACD, Stochastic. Data: exchange via Yahoo Finance.
Volatility, Volume & Key Levels
The Bollinger bands, which track price relative to a moving average and recent volatility, are widening. Their upper band is $336.95, the middle band is $296.46 and the lower band is $255.97. With the share price at 98% of the band range, it is pressing close to the upper boundary. The widening bands indicate elevated volatility, not a confirmed breakout.
Average True Range (ATR), a measure of typical price movement, is $12.09, or 3.6% of the share price. That is a substantial daily range relative to the stock’s price and raises the risk of sharp moves in either direction. Trading volume was 2,539,800 shares, about 0.7 times the 20-day average of 3,589,560. On-Balance Volume (OBV), which tracks whether volume flows more often accompany advances or declines, is rising. The combination suggests accumulation, but below-average turnover makes the latest price surge less firmly backed by trading participation.
The immediate levels are clear: $335.29 is 20-day resistance, while $268.03 is 20-day support. A sustained break above resistance would put the three-month high of $372.98 in focus; failure to hold the advance could expose the SMA50 at $321.03 before the deeper support level. These are conditional scenarios, not predictions.
Technical Verdict: HOLD (wait & see)
HOLD (wait & see) fits the conflicting evidence. Price is above both moving averages, MACD is positive and OBV is rising; against that, the stock sits at 20-day resistance, the Stochastic is overbought, and volume is below its 20-day average. The verdict is invalidated if price falls below $268.03, the stated 20-day support.
- Ideal entry range: $321.03–$335.29, bounded by the SMA50 and 20-day resistance.
- Exit target: $372.98, the three-month high.
- Stop-loss protection: $268.03, the 20-day support.
In plain English, the indicators show a strong rebound, but the price is testing resistance without normal trading volume.
Summary Data INTU
Last price
335.29 USD
Change 1 day / 5 days / 1 month
2.97% / 11.23% / 14.69%
Trend / MA-cross
sideways / none
SMA20 / SMA50
296.46 / 321.03
RSI (14) / Stochastic %K
65.3 / 89.9
Bollinger %B / ATR
98% / 12.09
Support / Resistance 20 days
268.03 / 335.29
Data as of
21 October 2026 03:00 WIB
Disclaimer: This technical analysis is generated automatically from exchange data (via Yahoo Finance) and indicators calculated by JournalArta, for information and education only. The verdict and the entry, target and stop-loss levels are not investment advice or a solicitation to buy or sell any security. Investment decisions and their risks rest solely with the reader.