KO Stock Gains 0.07%, RSI Overbought In Focus
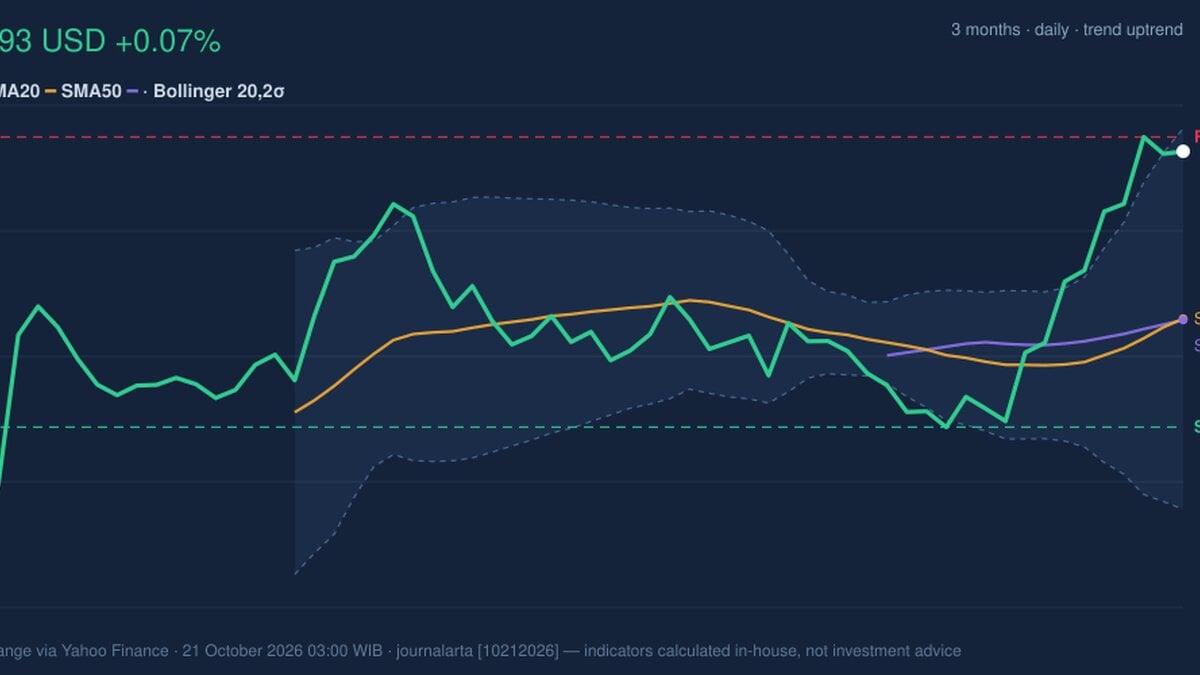
On October 20, 2026: price 93.49 USD, trend uptrend, RSI 72.2, support 85.65, resistance 93.90. technical analysis of ko stock. KO Stock Gains — full details…
Why KO is in focus today
- Trading near its 3-month high (94.10)
- Fresh golden cross: SMA20 crossed above SMA50
- RSI(14) at 72.2 — overbought zone
- Uptrend confirmed (5-day change 3.75%)
Selected automatically from 30 NYSE (US) stocks by a technical-signal score with daily weighted randomisation — not a recommendation.
Trend & Price Action
Coca-Cola is trading above both its 20-day simple moving average (SMA) of $88.73 and its 50-day SMA of $88.70. The 20-day average’s 1.41% rise over five days and the newly formed golden cross—when the shorter-term average moves above the longer-term one—show that recent price strength is being reflected in the trend indicators, not just in a single session. The shares have gained 5.51% over one month and sit at 95% of their 20-trading-day range, close to resistance at $93.90. They are also approaching the three-month high of $94.10. The closing price is only slightly below the upper Bollinger Band, at $94.15. Bollinger Bands measure how far price has moved relative to its recent average; a reading near the upper band can reflect strong demand, but also leaves less room before the stock meets nearby resistance. The band width is 12.2%, classified as normal, rather than unusually tight or expanded. Price is trending higher, but it is pressing against a cluster of nearby ceilings.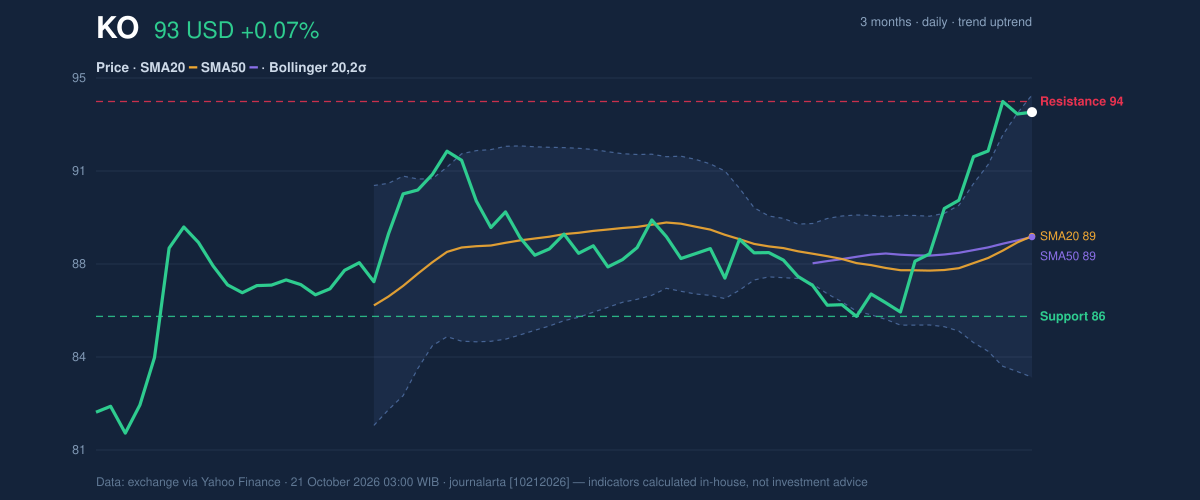
Oscillators & Momentum
Momentum indicators confirm the advance, while warning that it may be getting crowded. The RSI is 72.2, above the commonly used 70 threshold for an overbought reading. Stochastic %K at 93.2 and %D at 94.5 are also overbought. These readings do not, on their own, prove that a reversal is imminent. They indicate that the recent rise has been fast enough to leave the stock susceptible to profit-taking or a period of sideways trading. The MACD, a trend-momentum measure, remains constructive: its reading of 1.416 is above the signal line at 0.667, leaving a positive histogram of 0.750. This supports the upward trend rather than signaling a confirmed turn lower. The tension is between that positive MACD and the stretched RSI and Stochastic readings. Momentum is positive, but the pace of the move is elevated.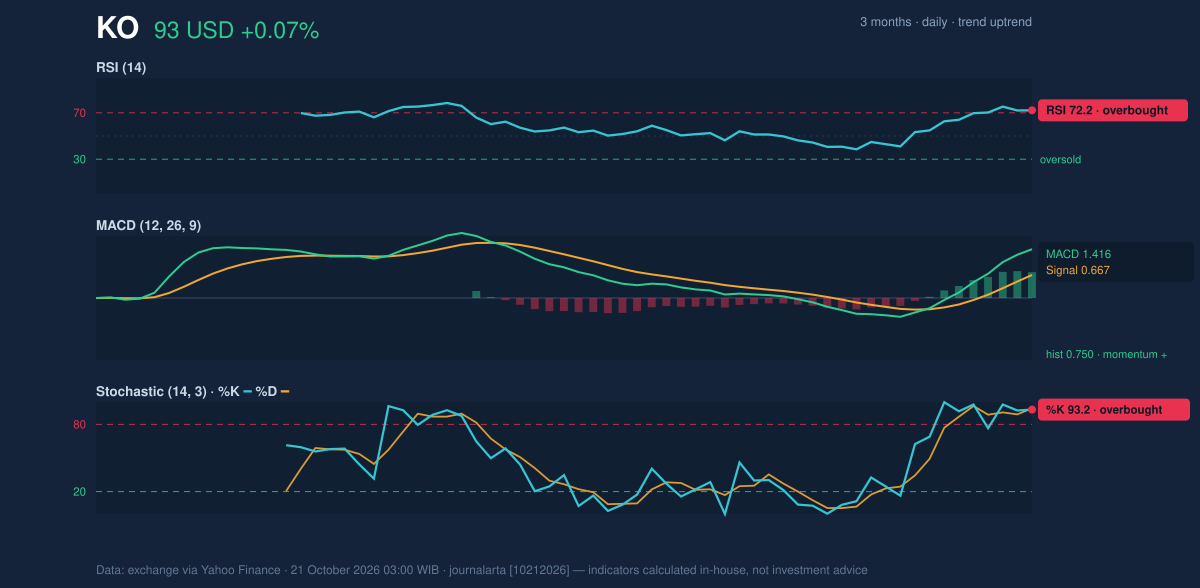
Volatility, Volume & Levels
Trading volume was 15,964,300 shares, close to the 20-day average of 15,891,955. That is roughly normal participation, so the advance is not accompanied by a major volume surge. On-balance volume (OBV), which tracks whether volume is flowing more heavily on rising or falling sessions, is increasing—another supportive sign, though not a measure of the move’s durability. Average true range (ATR) is $1.49, or 1.6% of the share price, indicating moderate day-to-day volatility. In practical terms, ordinary price swings remain possible even if the broader trend holds. The immediate test is resistance at $93.90, followed by the three-month high of $94.10 and the upper Bollinger Band at $94.15. A sustained move above that zone would put the shares beyond the stated resistance area; failure to clear it could leave room for a pullback toward the moving averages around $88.70. The stated 20-day support is $85.65, while the lower Bollinger Band at $83.31 offers a wider reference point if selling deepens.Technical Verdict: HOLD (wait & see)
The indicators favor the existing uptrend, but the price is near resistance and short-term momentum is overbought. The HOLD (wait & see) verdict reflects that balance: the golden cross and positive MACD are constructive, while RSI and Stochastic readings argue for caution near the recent highs. The verdict is invalidated if price falls below $85.65, the stated 20-trading-day support.- Ideal entry range: $88.70–$88.73, around the 50-day and 20-day moving averages.
- Exit target (target price): $94.10–$94.15, the three-month high and upper Bollinger Band.
- Stop-loss protection: Below $85.65, the 20-trading-day support.
Summary Data KO
| Last price | 93.49 USD |
| Change 1 day / 5 days / 1 month | 0.07% / 3.75% / 5.51% |
| Trend / MA-cross | uptrend / golden |
| SMA20 / SMA50 | 88.73 / 88.70 |
| RSI (14) / Stochastic %K | 72.2 / 93.2 |
| Bollinger %B / ATR | 94% / 1.49 |
| Support / Resistance 20 days | 85.65 / 93.90 |
| Data as of | 21 October 2026 03:00 WIB |
Disclaimer: This technical analysis is generated automatically from exchange data (via Yahoo Finance) and indicators calculated by JournalArta, for information and education only. The verdict and the entry, target and stop-loss levels are not investment advice or a solicitation to buy or sell any security. Investment decisions and their risks rest solely with the reader.
Track KO stock price daily: live levels, support/resistance and our full KO analysis history.