On October 20, 2026: price 1,879.50 USD, trend sideways, RSI 55.6, support 1,685.12, resistance 1,892.44. technical analysis of meli stock.
By Alistair Sterling
October 21, 20264 min read
MELI Testing Key Resistance
MercadoLibre rose 2.16% to $1,879.50, putting the Latin American e-commerce and fintech company close to a near-term resistance level as its broader trend remains sideways. The move matters because shares are above their 20-day and 50-day moving averages, while a short-term overbought reading and trading volume below average suggest the advance has yet to draw unusually strong participation.
Trend & Price Action
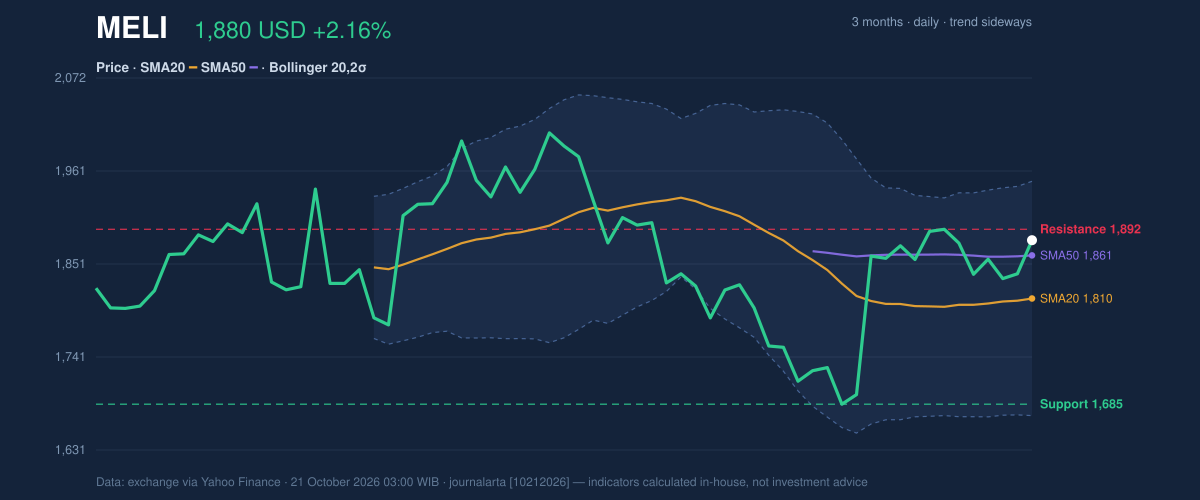
The last price of $1,879.50 is above the 20-day simple moving average (SMA) of $1,810.46 and the 50-day SMA of $1,861.46. A moving average smooths recent prices to show direction; the position above both measures is constructive, but it does not by itself establish a durable uptrend. The data show no new moving-average crossover, and the broader trend is classified as sideways. The 20-day average is rising modestly, up 0.42% over five trading days.
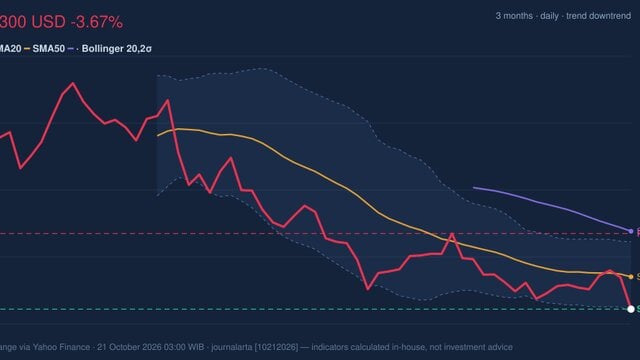
MercadoLibre has gained 2.90% over one month, but its five-day change is just 0.18%. At 94% of its 20-trading-day range, the stock is testing the upper end of recent trading rather than breaking away from it. The $1,892.44 resistance is only slightly above the latest price; support over the same period is $1,685.12. The three-month high of $2,066.00 and low of $1,668.44 provide wider context, with the current price below the high.
The price structure is improving, but the range has not yet been decisively cleared.3-month price action chart of MELI: price, SMA20/50, Bollinger, support & resistance. Data: exchange via Yahoo Finance.
The Bollinger Bands, which track price relative to a moving average and its typical variation, place the shares at 75% of the band’s width, between the $1,810.46 midpoint and $1,949.21 upper band. The bands are at normal width, not unusually compressed or expanded. That points to ordinary volatility rather than a signal of an imminent large move. The $1,949.21 upper band is a further reference if resistance gives way.
Oscillators & Momentum
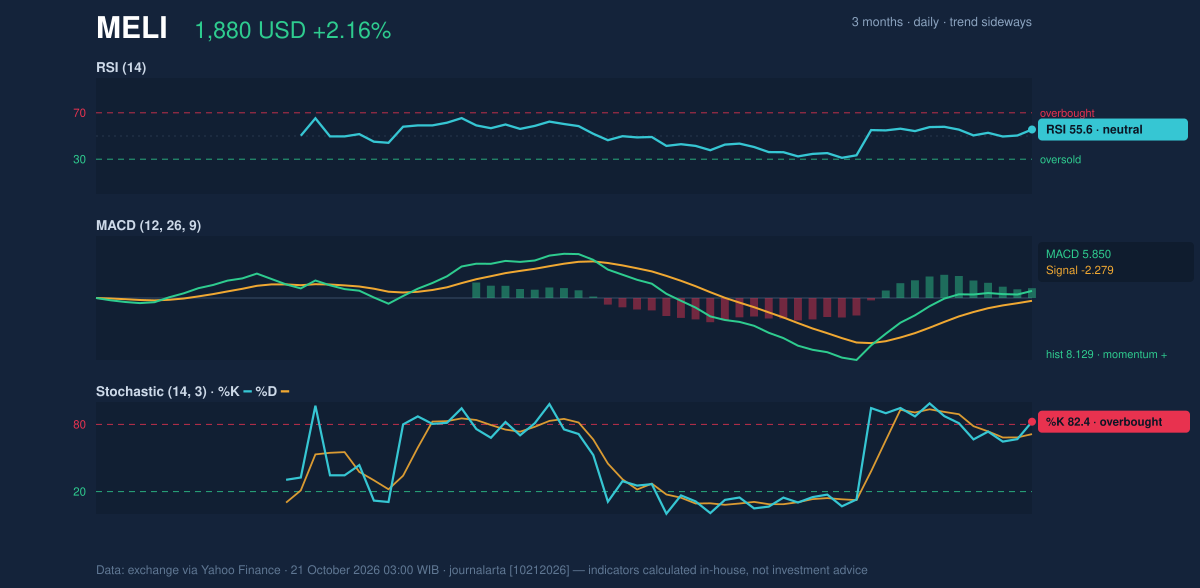
Momentum measures are mixed, a common pattern when a stock approaches resistance. The RSI is neutral at 55.6; the Relative Strength Index compares recent gains and losses, and this reading does not indicate an extreme in either direction. The Stochastic is overbought, with %K at 82.4 and %D at 71.3. This oscillator focuses on where a closing price sits within its recent range, so its elevated reading warns that the price has advanced toward the top of that range.
The MACD is positive at 5.850, above its -2.279 signal line, with a positive 8.129 histogram. The Moving Average Convergence Divergence indicator compares shorter- and longer-term price averages; its current configuration suggests strengthening upward momentum. That signal supports the price rise, though it sits alongside the Stochastic’s warning of near-term stretch.
Momentum chart of MELI: RSI(14), MACD, Stochastic. Data: exchange via Yahoo Finance.
Volatility, Volume & Key Levels
The average true range (ATR), a measure of typical daily price movement, is $56.41, or 3.0% of the share price—consistent with moderate volatility. Latest volume was 495,600 shares, against a 20-day average of 524,215, or 0.9 times normal. On-balance volume (OBV), which adds or subtracts volume according to price direction, is rising. That offers some confirmation of buying pressure, but below-average turnover makes the latest gain less conclusive than a rise accompanied by heavier trading.
A sustained move above $1,892.44 would clear the cited 20-day resistance; the upper Bollinger Band at $1,949.21 is the next technical reference in the data. If the stock fails at resistance, the $1,861.46 50-day average and $1,810.46 20-day average are nearer reference points, while a fall below $1,685.12 would breach the stated 20-day support. These are conditional levels, not forecasts.
Technical Verdict: HOLD (wait & see)
The technical reading is balanced: shares are above both moving averages, MACD is positive and OBV is rising, but the trend remains sideways, Stochastic is overbought, and volume is below its 20-day norm. The verdict is invalidated if price falls below $1,685.12, the 20-day support.
Ideal Entry Range: $1,810.46–$1,861.46, around the 20-day and 50-day moving averages.
Exit Target: $1,949.21, the upper Bollinger Band.
Stop Loss: $1,685.12, the 20-day support.
For non-traders, the indicators show a share price with positive momentum but not yet a clear break from its recent range.
Indicator
Latest reading
Last price
$1,879.50
20-day / 50-day SMA
$1,810.46 / $1,861.46
20-day support / resistance
$1,685.12 / $1,892.44
RSI / Stochastic
55.6 / overbought
MACD
5.850; positive histogram 8.129
Volume vs. 20-day average
0.9×
Source: Exchange data via Yahoo Finance, as of October 21, 2026, 03:00 WIB.
Summary Data MELI
Last price
1,879.50 USD
Change 1 day / 5 days / 1 month
2.16% / 0.18% / 2.90%
Trend / MA-cross
sideways / none
SMA20 / SMA50
1,810.46 / 1,861.46
RSI (14) / Stochastic %K
55.6 / 82.4
Bollinger %B / ATR
75% / 56.41
Support / Resistance 20 days
1,685.12 / 1,892.44
Data as of
21 October 2026 03:00 WIB
Disclaimer: This technical analysis is generated automatically from exchange data (via Yahoo Finance) and indicators calculated by JournalArta, for information and education only. The verdict and the entry, target and stop-loss levels are not investment advice or a solicitation to buy or sell any security. Investment decisions and their risks rest solely with the reader.