META Stock Drops 1.59% on Tuesday, Testing Support Level
On October 20, 2026: price 694.25 USD, trend sideways, RSI 46.1, support 694.25, resistance 777.59. technical analysis of meta stock. META Stock Drops — full…
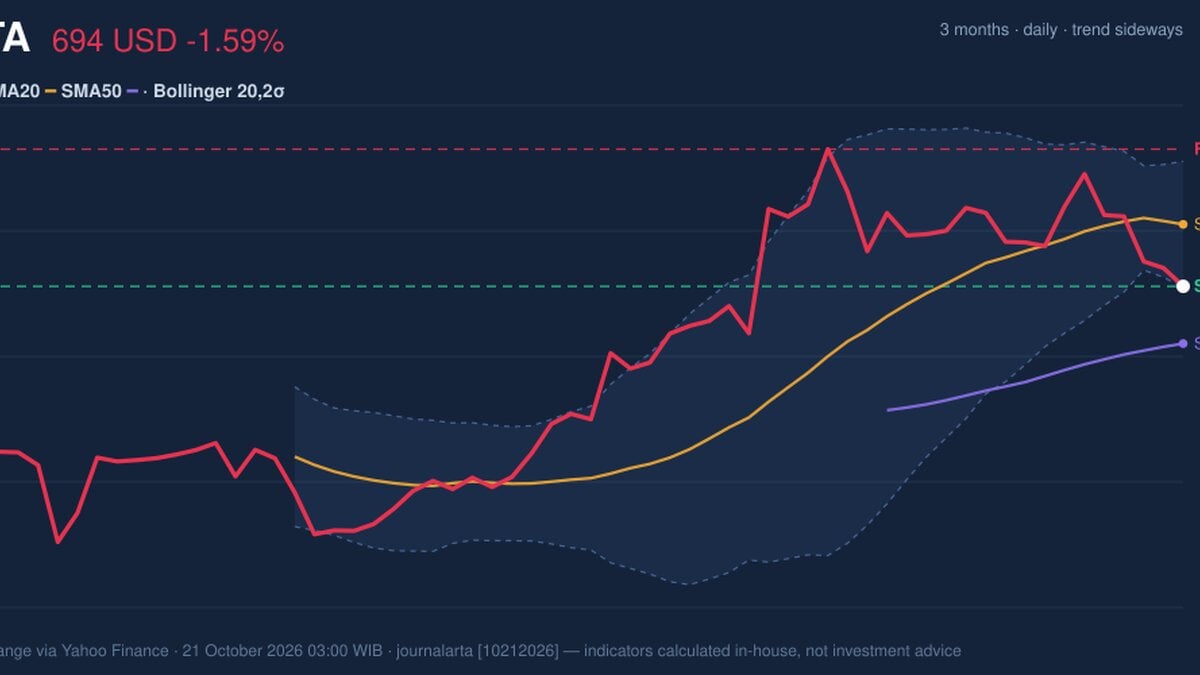
Meta Platforms closed at $694.25, its lowest level in 20 trading days, as shares fell 1.59% on the day and 8.95% over five days. The move places the stock at the lower edge of its recent range: price is below its 20-day average, while momentum and declining trading participation offer little confirmation that the retreat has ended.
Why META is in focus today
- Closed at a 20-day low (694.25)
Selected automatically from 32 NASDAQ (US) stocks by a technical-signal score with daily weighted randomisation — not a recommendation.
Trend & Price Action
The broader structure is sideways, but the short-term picture has weakened. Meta is down 5.75% over one month and trades below its 20-day simple moving average of $731.87. The average itself is still rising slightly, by 0.58% over five days, which suggests the recent decline has outpaced the still-positive slope of the trend measure rather than establishing a clear long-term reversal. The 50-day average at $659.49 remains below the share price, and there has been no new moving-average cross.
That combination matters: price below the shorter average signals near-term pressure, while its position above the longer average leaves the larger trend less decisively damaged. Meta is at the bottom of its 20-day range, with $694.25 as nearby support and $777.59 as resistance. Over three months, the high and low were $779.82 and $524.49, respectively, showing that the current pullback follows a much wider span of trading.
As shown in the chart, the price is pressing against the lower Bollinger Band rather than trading near the middle of its recent range.
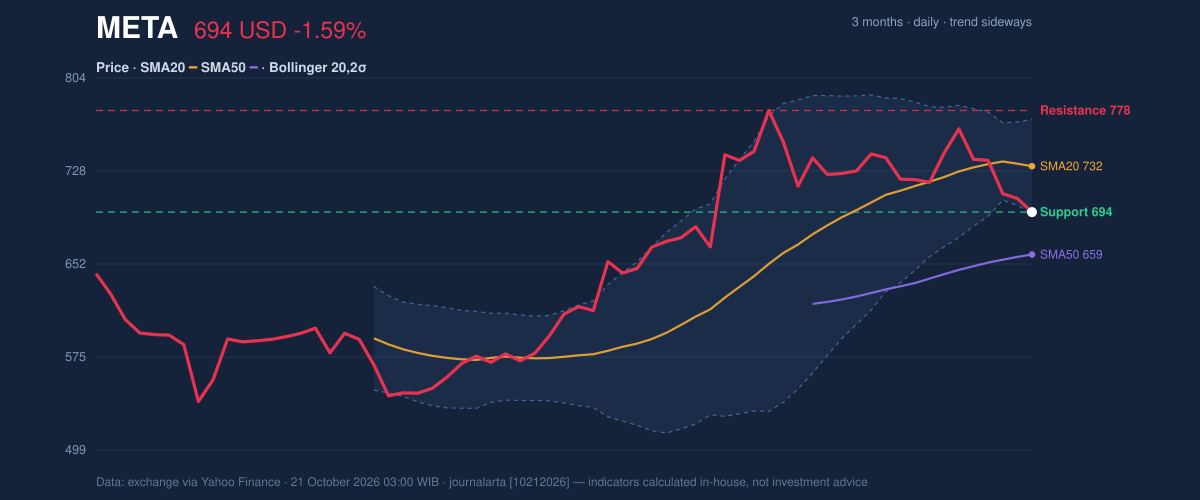
The lower band is $693.57, barely below the last close, while the middle band is $731.87. Bollinger Bands measure how far price is moving from a recent average; a touch near the lower band can reflect strong selling pressure, but it does not by itself confirm a rebound. The band width is 10.5%, described as normal, so the data do not point to an unusually compressed setup poised for a dramatic volatility release.
Oscillators & Momentum
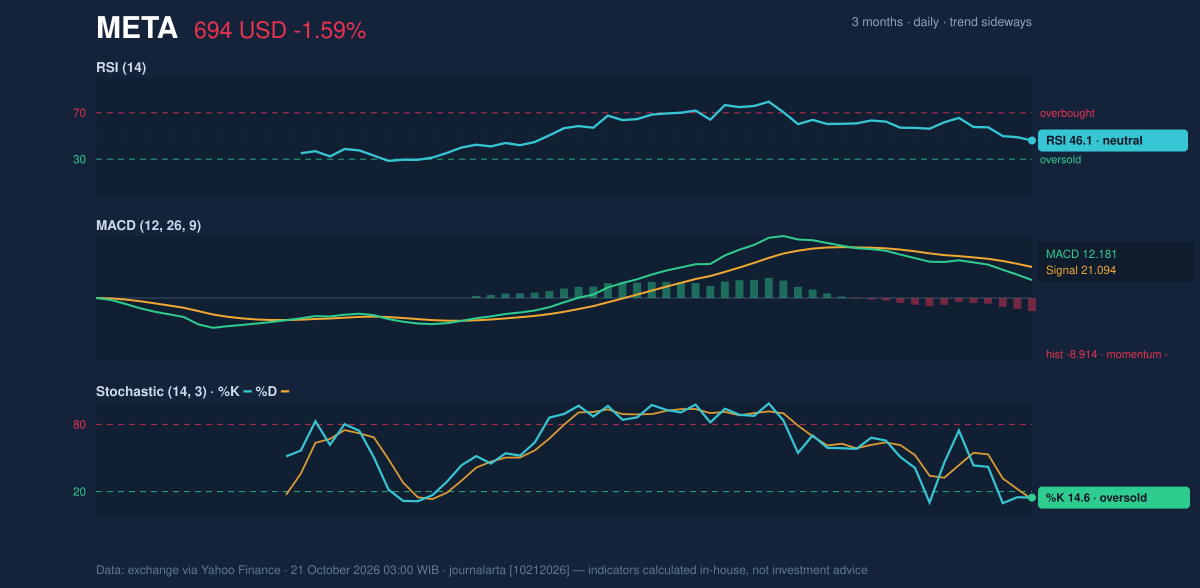
Momentum indicators lean weaker than the neutral headline reading suggests. The RSI is 46.1, a neutral reading, indicating neither a strong overbought nor oversold condition. But the Stochastic is oversold, with %K at 14.6 and %D at 13.1. Stochastic compares a close with its recent trading range; low readings show that price has been closing near the bottom of that range, not that a recovery is assured.
The MACD points in the same bearish direction. Its reading of 12.181 is below the 21.094 signal line, leaving a negative histogram of -8.914. That gap indicates fading momentum, even as the oversold Stochastic leaves room for a short-lived bounce. The distinction is important: oversold describes how far a decline has progressed, while MACD suggests whether selling momentum is easing. Here, the latter has not yet turned positive.
As shown in the chart, the Stochastic is depressed while MACD remains below its signal line, a mixed setup rather than a confirmed reversal.
Volatility, Volume & Key Levels
Average true range, a measure of typical daily price movement, is $21.90, or 3.2% of the share price, indicating moderate volatility. Trading volume was 16,957,600 shares, about 0.9 times the 20-day average of 19,595,690. Volume was therefore below normal as the stock fell; that limits evidence of a broad surge in selling, but the declining on-balance volume (OBV)—a running measure that tracks whether volume accompanies up or down days—still points to weakening participation.
The immediate test is whether $694.25 holds. A sustained break below that 20-day support would weaken the already pressured chart, while a recovery above the 20-day average at $731.87 would improve the near-term structure. The upper range resistance at $777.59 is a more distant hurdle; the stock would need to regain ground before that level becomes a practical test.
Technical Verdict: HOLD
Core verdict: HOLD (wait & see), because the indicators conflict rather than align around a clear directional signal. The share price is below the 20-day average and the MACD histogram is negative; the Stochastic is oversold, while price remains above the 50-day average. Lower-than-average volume and falling OBV add caution, without independently confirming a sharp breakdown.
- Ideal Entry Range: $694.25–$731.87, bounded by 20-day support and the 20-day average.
- Exit Target: $777.59, the 20-day resistance level.
- Stop Loss: below $693.57, the lower Bollinger Band.
The verdict is invalidated if price breaks below $693.57. In plain English, the chart is still under pressure, but its mixed signals do not yet settle whether that pressure will deepen or ease.
Summary Data META
| Last price | 694.25 USD |
| Change 1 day / 5 days / 1 month | -1.59% / -8.95% / -5.75% |
| Trend / MA-cross | sideways / none |
| SMA20 / SMA50 | 731.87 / 659.49 |
| RSI (14) / Stochastic %K | 46.1 / 14.6 |
| Bollinger %B / ATR | 1% / 21.90 |
| Support / Resistance 20 days | 694.25 / 777.59 |
| Data as of | 21 October 2026 03:00 WIB |
Disclaimer: This technical analysis is generated automatically from exchange data (via Yahoo Finance) and indicators calculated by JournalArta, for information and education only. The verdict and the entry, target and stop-loss levels are not investment advice or a solicitation to buy or sell any security. Investment decisions and their risks rest solely with the reader.
Track META stock price daily: live levels, support/resistance and our full META analysis history.