OCBC Stock Drops 0.41% on Tuesday, Death Cross Pressure
On October 20, 2026: price 28.80 SGD, trend downtrend, RSI 30.2, support 28.80, resistance 32.22. technical analysis of ocbc stock. OCBC Stock Drops — full…
Why OCBC is in focus today
- Trading near its 3-month low (28.25)
- Fresh death cross: SMA20 crossed below SMA50
- Downtrend extending (5-day change -1.37%)
Selected automatically from 16 SGX (Singapore) stocks by a technical-signal score with daily weighted randomisation — not a recommendation.
Trend & Price Action
At SGD 28.80, OCBC is below both its SMA20 of SGD 30.51 and SMA50 of SGD 31.06. The SMA20 has crossed below the SMA50, a death cross that signals the shorter-term trend has weakened relative to the longer-term average. The SMA20’s slope—down 2.08% over five trading days—shows that pressure is continuing, rather than merely reflecting a single weak session. The price sits at the lower edge of its 20-trading-day range, where support is marked at SGD 28.80, and near the three-month low of SGD 28.25. That proximity makes the level important, but not automatically dependable: a support level is an area where demand has previously emerged, not a guarantee that buyers will step in again. As shown in the chart, the lower Bollinger band is at SGD 27.67, below the current price, while the upper band is at SGD 33.35.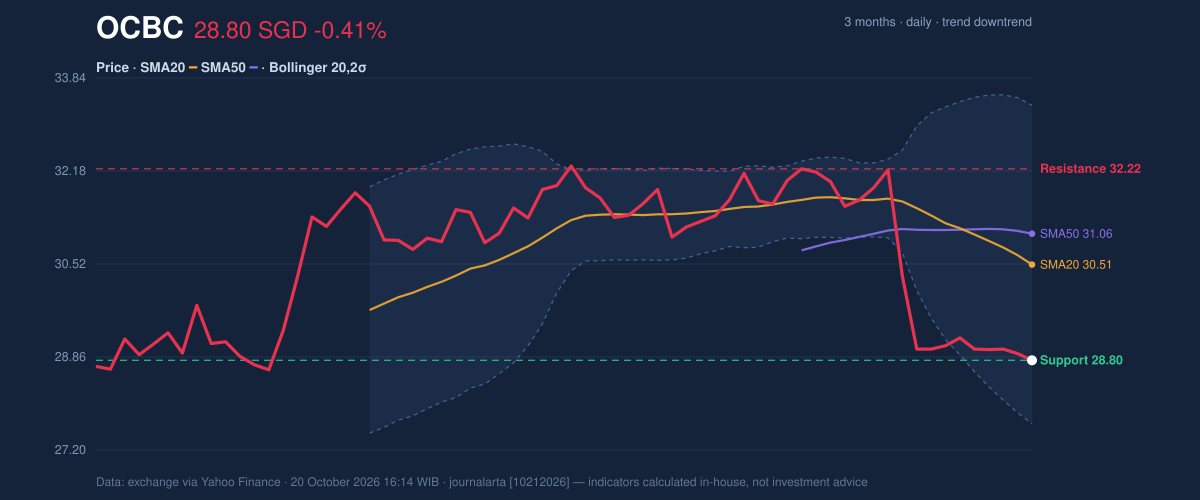
Oscillators & Momentum
The indicators are weak, though they differ on how stretched the decline has become. RSI(14) is 30.2, labelled neutral in the supplied data, while the Stochastic readings—%K at 7.9 and %D at 9.4—are oversold. An oversold reading means recent losses have been unusually persistent; it can precede a bounce, but it does not by itself establish that a trend has turned. MACD reinforces the downside signal. MACD is -0.696, below its -0.480 signal line, with a negative histogram of -0.216. In plain terms, the indicator shows downward momentum still outweighing any recovery signal. A sustained improvement would need more than a low Stochastic reading: the price and momentum indicators would have to start moving in the same direction.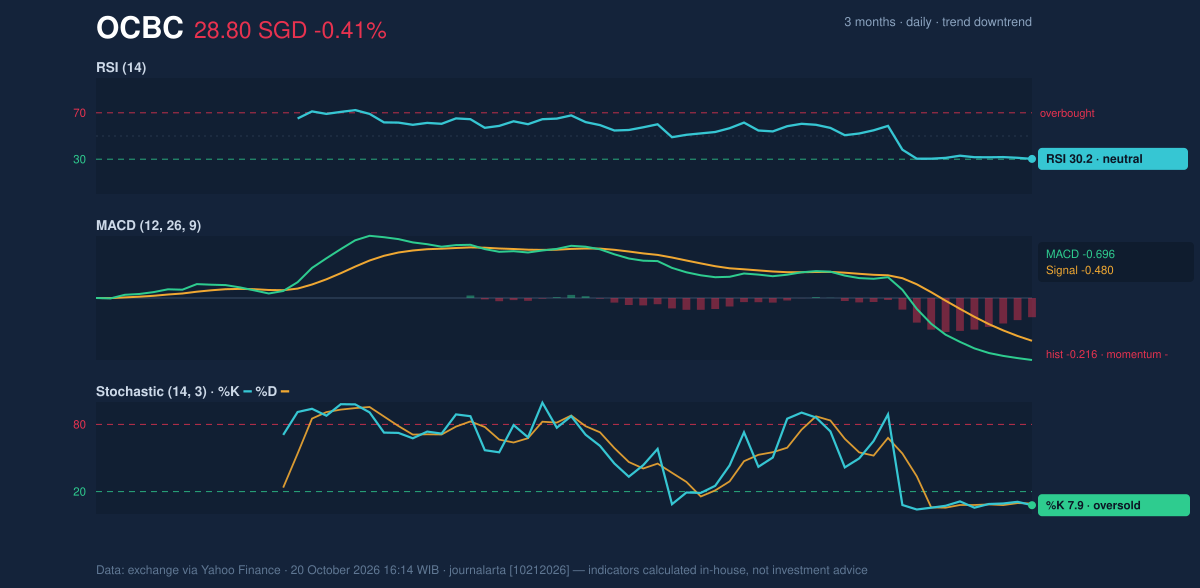
Volatility, Volume & Levels
The Bollinger-band position puts the price in the lower fifth of the band range, with %B at 20%. That reflects the share price’s weakness relative to its recent trading envelope. The band width is 18.6%, described as normal, so the data do not point to an unusually compressed market setup that would, on its own, suggest a sharp breakout is imminent. ATR is SGD 0.66, or 2.3% of the price, indicating moderate daily movement. Trading participation was subdued: volume of 5,158,760 shares was about 0.6 times the 20-trading-day average of 8,530,459, while OBV was falling. OBV tracks whether volume is heavier on rising or falling sessions; its decline is consistent with selling pressure, although below-average turnover means the latest move had less participation than usual. The immediate test is support at SGD 28.80. A break below it would put the three-month low of SGD 28.25 and the lower Bollinger band at SGD 27.67 in focus. If support holds, the first significant resistance is SGD 32.22; the SMA20 at SGD 30.51 and SMA50 at SGD 31.06 lie between the current price and that resistance, making them potential hurdles on any rebound.Technical Verdict: HOLD (wait & see)
The indicators favour caution rather than a confirmed reversal: the death cross and falling SMA20 point to a continuing downtrend; MACD remains negative; and OBV is declining. Oversold Stochastic readings leave room for a short-term bounce, but do not outweigh those broader signals. The verdict is invalidated if the price breaks below SGD 28.25, the three-month low. The levels below are technical reference points derived solely from the supplied support, resistance, moving averages and Bollinger bands. - Entry range: SGD 28.25–28.80, around the three-month low and 20-trading-day support. - Exit target: SGD 30.51–32.22, spanning the SMA20 to the stated resistance. - Stop-loss protection: Below SGD 27.67, the lower Bollinger band. For non-traders, the chart shows a weak trend that is nearing support, but has not yet produced a clear sign of recovery.Summary Data OCBC
| Last price | 28.80 SGD |
| Change 1 day / 5 days / 1 month | -0.41% / -1.37% / -10.39% |
| Trend / MA-cross | downtrend / death |
| SMA20 / SMA50 | 30.51 / 31.06 |
| RSI (14) / Stochastic %K | 30.2 / 7.9 |
| Bollinger %B / ATR | 20% / 0.66 |
| Support / Resistance 20 days | 28.80 / 32.22 |
| Data as of | 20 October 2026 16:14 WIB |
Disclaimer: This technical analysis is generated automatically from exchange data (via Yahoo Finance) and indicators calculated by JournalArta, for information and education only. The verdict and the entry, target and stop-loss levels are not investment advice or a solicitation to buy or sell any security. Investment decisions and their risks rest solely with the reader.
Track OCBC share price daily: live levels, support/resistance and our full OCBC analysis history.