Ping An Stock Drops 1.70%, RSI Oversold In Focus
On October 20, 2026: price 49.20 HKD, trend downtrend, RSI 21.9, support 49.20, resistance 53.90. technical analysis of ping an stock. Ping An Stock Drops —…
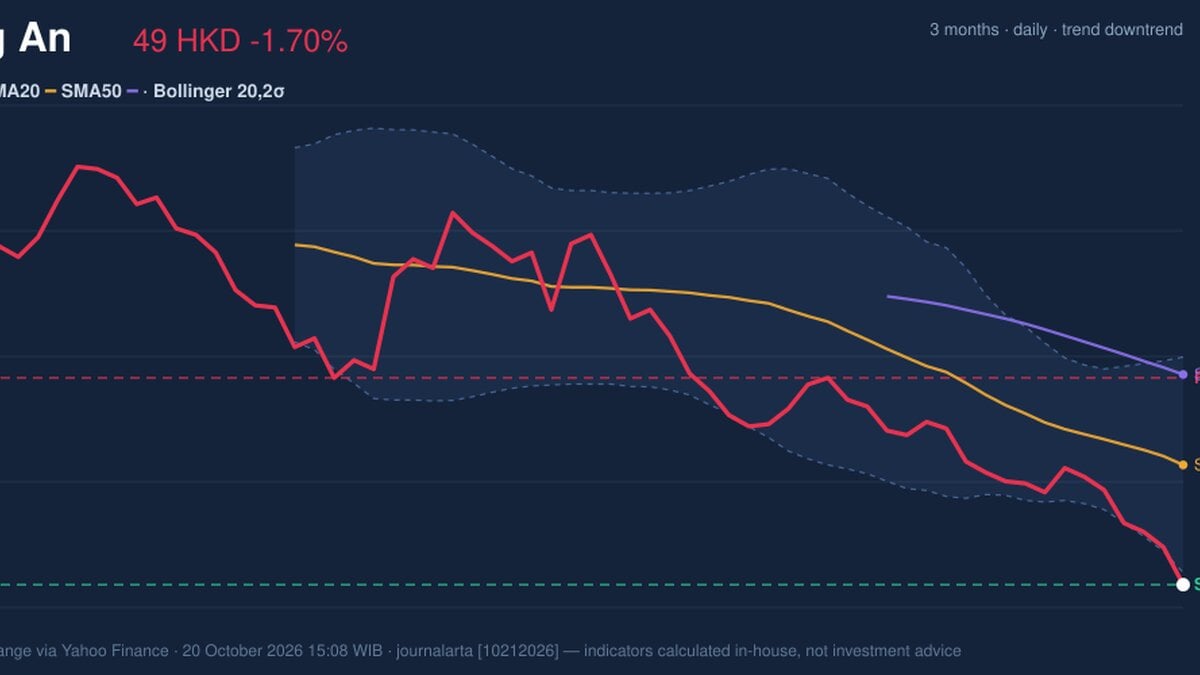
Why Ping An is in focus today
- Volume at 1.5× the 20-day average
- Closed at a 20-day low (49.20)
- Trading near its 3-month low (49.20)
- RSI(14) at 21.9 — oversold zone
- Downtrend extending (5-day change -4.74%)
Selected automatically from 16 HKEX (Hong Kong) stocks by a technical-signal score with daily weighted randomisation — not a recommendation.
Trend & Price Action
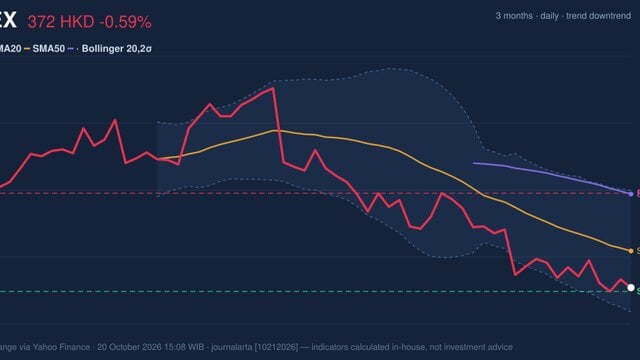
Ping An remains in a downtrend. Its price is below both the 20-day simple moving average (SMA), at HK$51.92, and the 50-day SMA, at HK$53.98. A moving average smooths recent prices to show the prevailing direction; trading beneath both averages suggests that weakness is not confined to a single session. The 20-day average is also falling, with its slope down 1.32% over five days. No new moving-average crossover has formed. The Bollinger lower band, a measure of price movement relative to recent volatility, stood at HK$49.47—slightly above the close. The price’s position below that band produced a negative 6% reading on the band’s %B measure. This points to unusually weak positioning, but does not by itself prove a reversal: prices can remain near or below a lower band during a sustained decline. The stock has fallen from a three-month high of HK$59.00 to HK$49.20, its low for that period. As shown in the chart, the immediate issue is whether the support zone can hold. [ GRAFIK-HARGA ]Oscillators & Momentum
Momentum indicators show an oversold market, not yet a confirmed turnaround. The RSI is 21.9, in oversold territory; the Stochastic oscillator is also deeply stretched, with %K at 0.0 and %D at 7.0. These measures compare recent losses with the pace of price moves. At such low readings, selling may be extended, but a bounce requires buyers to return. The MACD—a trend and momentum indicator—remains negative. Its reading of -1.163 is below the -1.011 signal line, while the histogram is -0.151. That configuration means downward momentum is still dominant, despite the oversold readings. The distinction matters: oversold conditions describe the speed and extent of the fall; they do not cancel the trend. As shown in the momentum chart, the oscillators are compressed near extreme lows while MACD remains negative. [ GRAFIK-MOMENTUM ]Volatility, Volume & Key Levels
Turnover reached 40,822,765 shares, about 1.5 times the 20-day average of 26,540,590. Elevated volume on a decline indicates that the move drew more participation than usual. On-balance volume (OBV), which tracks whether volume accompanies rising or falling prices, is also down—another sign that buying has not yet confirmed a floor. Average true range, a gauge of typical daily movement, was HK$0.88, or 1.8% of the share price, indicating moderate volatility. The Bollinger-band width was 9.4%, also described as normal, so the data do not show a broad volatility expansion despite the sharp fall. HK$49.20 is the immediate support and the key near-term test. A failure to hold it would mean the stock has slipped below both its 20-day support and three-month low in the supplied data. Resistance is at HK$53.90; above that, the 20-day average at HK$51.92 is an intervening recovery hurdle. A move back above those levels could ease the technical pressure, but would not alone reverse the broader downtrend.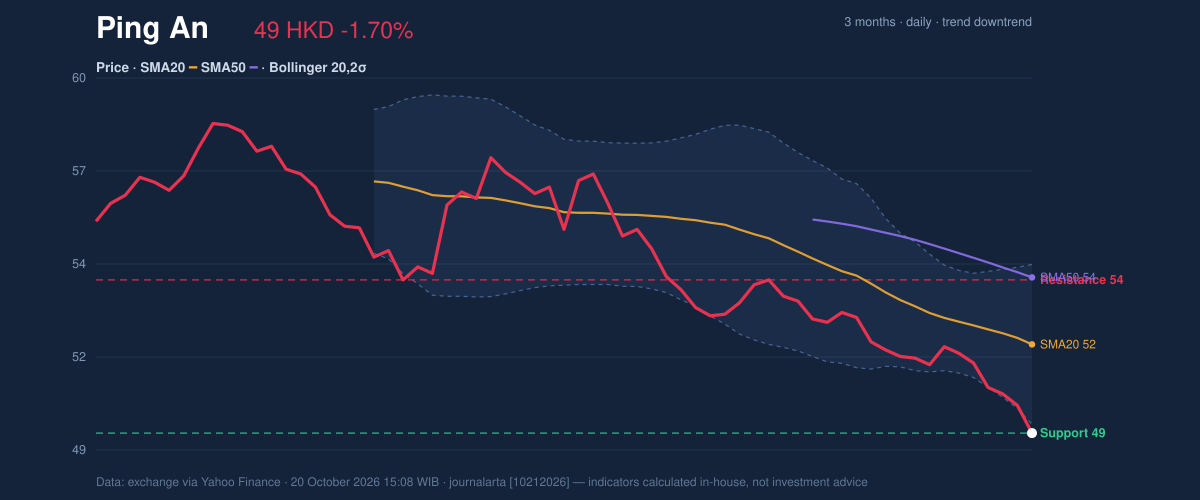
Technical Verdict: HOLD (wait & see)
The verdict reflects conflicting signals: deeply oversold RSI and Stochastic readings raise the possibility of a rebound, but the falling trend, negative MACD and declining OBV do not confirm one. The heavy volume accompanying the drop adds caution rather than clear evidence of accumulation. - Ideal Entry Range: HK$49.20–HK$51.92, bounded by the recorded support and 20-day SMA; the lower end depends on support holding. - Exit Target (Target Price): HK$53.90, the stated 20-day resistance. - Stop Loss: Below HK$49.20, which would invalidate the support-hold scenario. - Invalidation condition: The HOLD verdict is invalidated if the price breaks below HK$49.20. The indicators say the shares are stretched lower, but a durable recovery is not yet confirmed. In plain English, the price has fallen far enough to make a bounce possible, while the underlying trend remains weak.Summary Data Ping An
| Last price | 49.20 HKD |
| Change 1 day / 5 days / 1 month | -1.70% / -4.74% / -7.52% |
| Trend / MA-cross | downtrend / none |
| SMA20 / SMA50 | 51.92 / 53.98 |
| RSI (14) / Stochastic %K | 21.9 / 0.0 |
| Bollinger %B / ATR | -6% / 0.88 |
| Support / Resistance 20 days | 49.20 / 53.90 |
| Data as of | 20 October 2026 15:08 WIB |
Disclaimer: This technical analysis is generated automatically from exchange data (via Yahoo Finance) and indicators calculated by JournalArta, for information and education only. The verdict and the entry, target and stop-loss levels are not investment advice or a solicitation to buy or sell any security. Investment decisions and their risks rest solely with the reader.
Track Ping An share price daily: live levels, support/resistance and our full Ping An analysis history.