CapitaLand Investment Stock Technicals: Gains 0.87% on Wednesday, RSI Oversold
On October 21, 2026: price 2.33 SGD, trend downtrend, RSI 24.6, support 2.31, resistance 2.62. technical analysis of capitaland investment stock.
Trend & Price Action
At SGD 2.33, the stock trades below its 20-day average of SGD 2.47 and 50-day average of SGD 2.58. The 20-day average is falling, down 2.63% over five trading days, while no new moving-average crossover has formed. In plain terms, the share price remains beneath its recent trend benchmarks, and the shorter-term trend is still weakening rather than turning higher. The price sits near the bottom of its 20-trading-day range: support is SGD 2.31 and resistance is SGD 2.62, placing the latest close just 6% of the way up that range. It is also close to the three-month low of SGD 2.29. That proximity may attract attention, but a low price within a range is not, on its own, evidence that selling has ended. As shown in the chart, the price remains below both moving averages and near the lower Bollinger Band.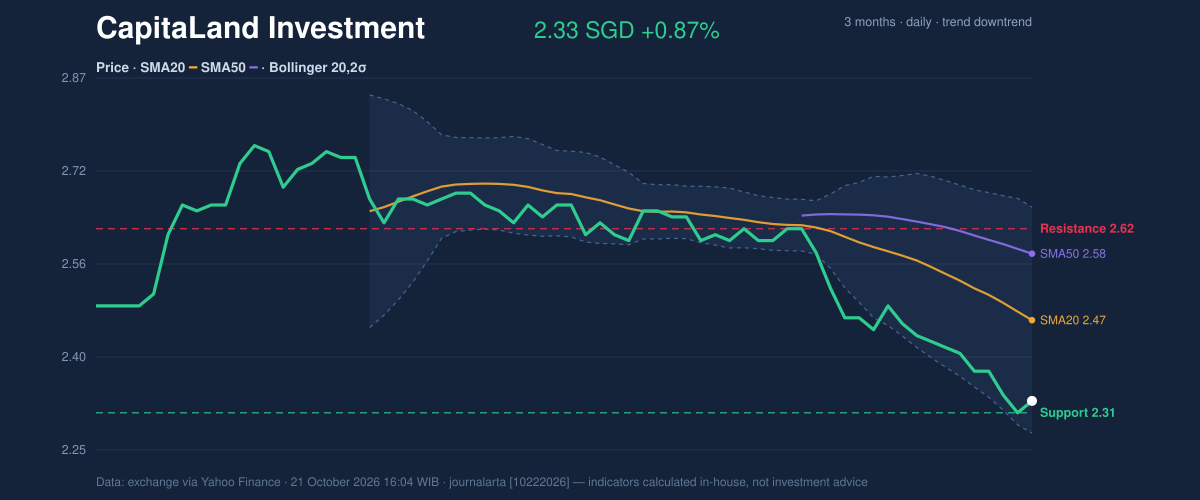
Oscillators & Momentum
The RSI is 24.6, an oversold reading, while Stochastic %K at 16.0 and %D at 9.9 are also in oversold territory. These measures compare recent price movements to judge whether a share has fallen sharply over a short period. Such readings can precede a rebound, but they can also persist during a sustained decline; they are not a timing signal on their own. The MACD remains negative at -0.071, below its -0.059 signal line, with a negative histogram of -0.012. That alignment points to continuing downside momentum, countering the possibility of a reversal suggested by the oversold oscillators. The indicators therefore tell a divided story: the fall has been sharp, but momentum has not yet confirmed a turn. The chart below shows the RSI and Stochastic readings against MACD’s still-negative signal.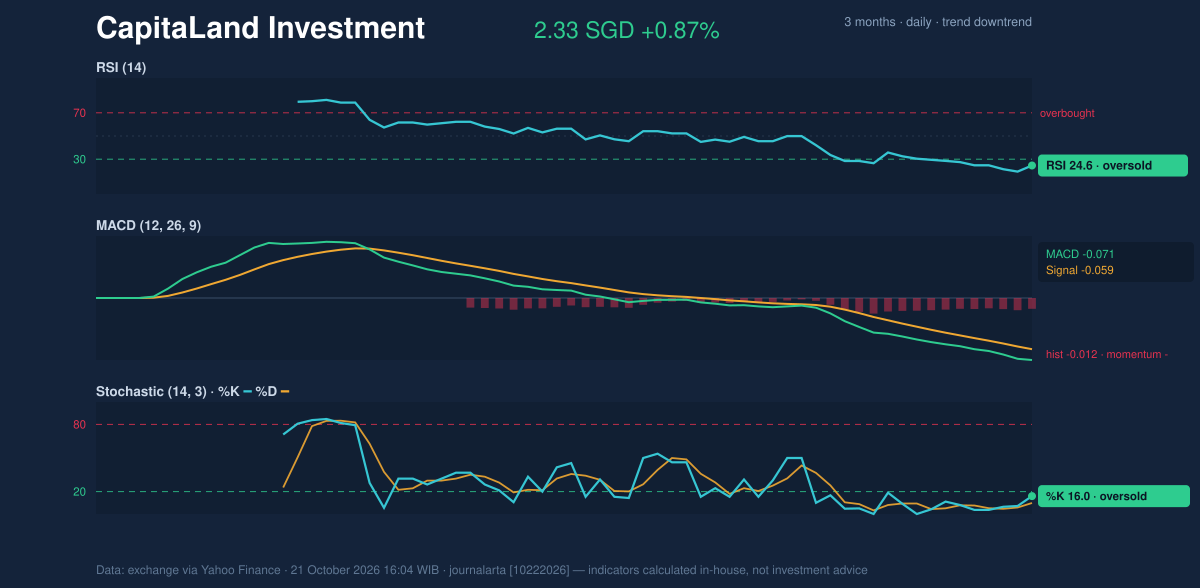
Volatility & Volume
The share trades at 14% of the way between the Bollinger Bands, near the lower band at SGD 2.28 and well below the middle band at SGD 2.47. Bollinger Bands measure how far a price is moving relative to its recent average; a reading near the lower edge signals weakness, not a guaranteed rebound. The band width is 15.4%, described as normal, so the data do not point to an unusually compressed setup that might foreshadow a sharp move. Trading volume reached 27,675,800 shares, or 2.1 times its 20-day average of 13,428,975. That unusually active session makes the price action more consequential than a move on thin trading, but the falling On-Balance Volume (OBV)—a measure that tracks whether volume generally accompanies rising or falling prices—does not yet confirm accumulation. The average true range is SGD 0.05, equivalent to 2.0% of the share price, indicating moderate day-to-day volatility.Key Levels & Scenarios
The first near-term test is SGD 2.31 support, close to the latest price; below it, the three-month low of SGD 2.29 becomes the next reference point in the supplied data. Holding those levels while momentum stabilises would make the oversold readings more relevant. A failure to hold them, however, would leave the downtrend intact. On a recovery, the 20-day average at SGD 2.47 is an early hurdle, followed by SGD 2.62 resistance. A move through those levels would improve the price structure, though the current MACD and falling OBV mean confirmation is still absent.Technical Verdict: HOLD
HOLD (wait & see) best fits the mixed technical picture: RSI and Stochastic are oversold, but MACD remains negative; the price is below falling short-term and longer-term averages; and OBV is declining despite the volume surge. The verdict is invalidated if the price falls below SGD 2.29, the three-month low.- Illustrative entry range: SGD 2.29–2.31, anchored to the three-month low and 20-day support.
- Illustrative exit target: SGD 2.47–2.62, spanning the 20-day average and 20-day resistance.
- Illustrative stop-loss protection: below SGD 2.28, the lower Bollinger Band.
Data note: Market data from the exchange via Yahoo Finance, as of 21 October 2026, 16:04 WIB.
Why CapitaLand Investment is in focus today
- Volume at 2.1× the 20-day average
- Trading near its 3-month low (2.29)
- RSI(14) at 24.6 — oversold zone
- Downtrend extending (5-day change -3.32%)
Selected automatically from 16 SGX (Singapore) stocks by a technical-signal score with daily weighted randomisation — not a recommendation.
Summary Data CapitaLand Investment
| Last price | 2.33 SGD |
| Change 1 day / 5 days / 1 month | 0.87% / -3.32% / -11.07% |
| Trend / MA-cross | downtrend / none |
| SMA20 / SMA50 | 2.47 / 2.58 |
| RSI (14) / Stochastic %K | 24.6 / 16.0 |
| Bollinger %B / ATR | 14% / 0.05 |
| Support / Resistance 20 days | 2.31 / 2.62 |
| Data as of | 21 October 2026 16:04 WIB |
Disclaimer: This technical analysis is generated automatically from exchange data (via Yahoo Finance) and indicators calculated by JournalArta, for information and education only. The verdict and the entry, target and stop-loss levels are not investment advice or a solicitation to buy or sell any security. Investment decisions and their risks rest solely with the reader.
Track CapitaLand Investment share price daily: live levels, support/resistance and our full CapitaLand Investment analysis history.