Genting Singapore Stock Analysis: Drops 0.00%, Testing Support Level
On October 21, 2026: price 0.61 SGD, trend downtrend, RSI 37.5, support 0.61, resistance 0.63. technical analysis of genting singapore stock.
Trend & Price Action
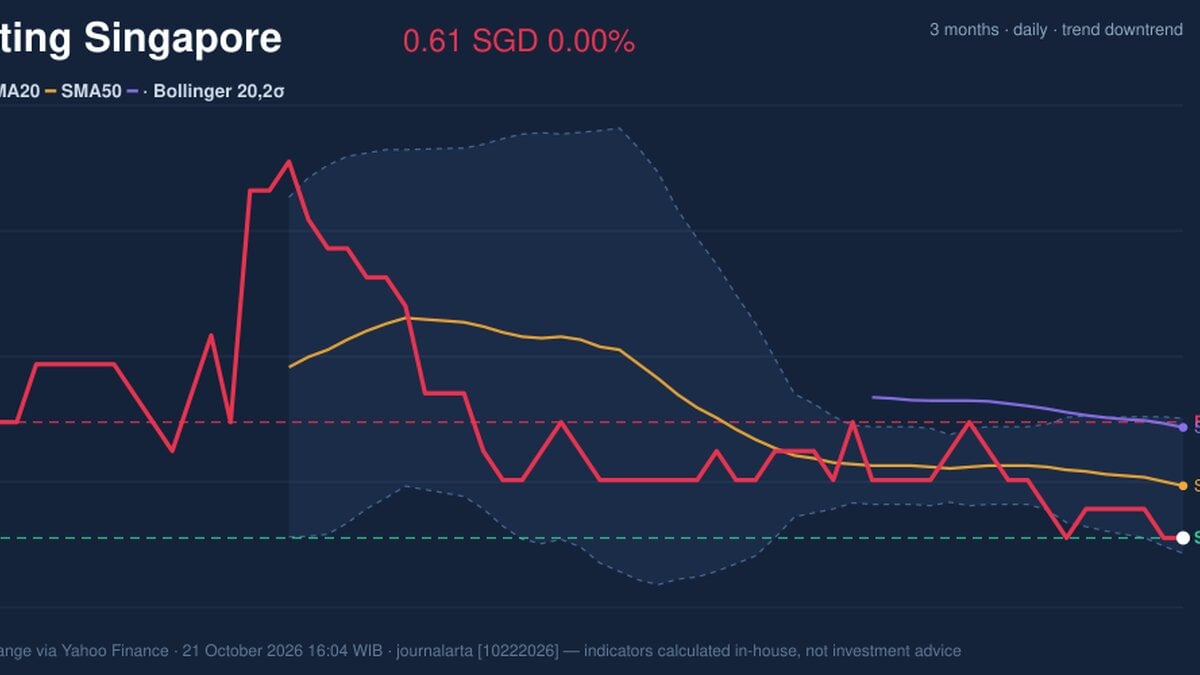
There has been no recent moving-average crossover, so the data do not show a fresh shift in trend. Instead, the price structure is defined by proximity to the floor: the stock is at the bottom of its 20-day range and close to the three-month low of SGD 0.60. The 20-day resistance is SGD 0.63, the upper Bollinger band, making that level the nearest hurdle for any recovery. As shown in the chart, the price is pressed against the lower end of its recent range, with the SMA20 and SMA50 above it. That positioning matters: support can attract buyers, but a low close alone does not confirm a rebound. A move back above the short-term average would provide firmer evidence that selling pressure is easing.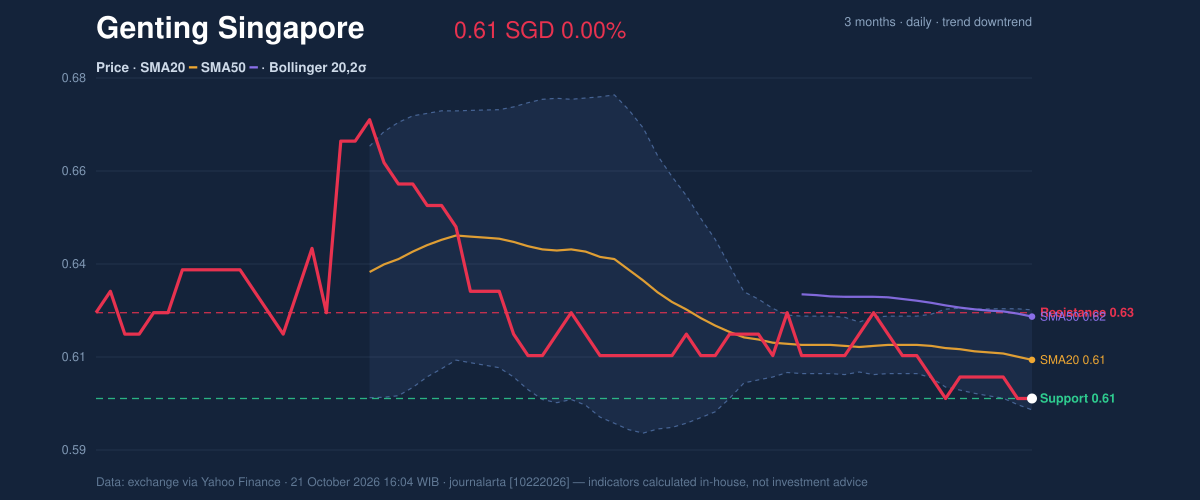
Oscillators & Momentum
Momentum indicators are mixed, but not yet supportive of a clear reversal. The RSI is 37.5, a neutral reading leaning toward weakness; it is below the midpoint of its scale, though not at an extreme. The Stochastic is oversold, with %K at 20.0 and %D at 26.7. Oversold readings can mean recent losses have been steep, but they do not by themselves show that buyers have returned. The MACD remains negative at -0.004, with a -0.001 histogram, indicating that downward momentum persists. In plain terms, the Stochastic points to an extended decline, while MACD says the decline has not clearly turned. The chart helps distinguish those signals: a turn in momentum would be more convincing if the oscillators improved alongside a price move above resistance.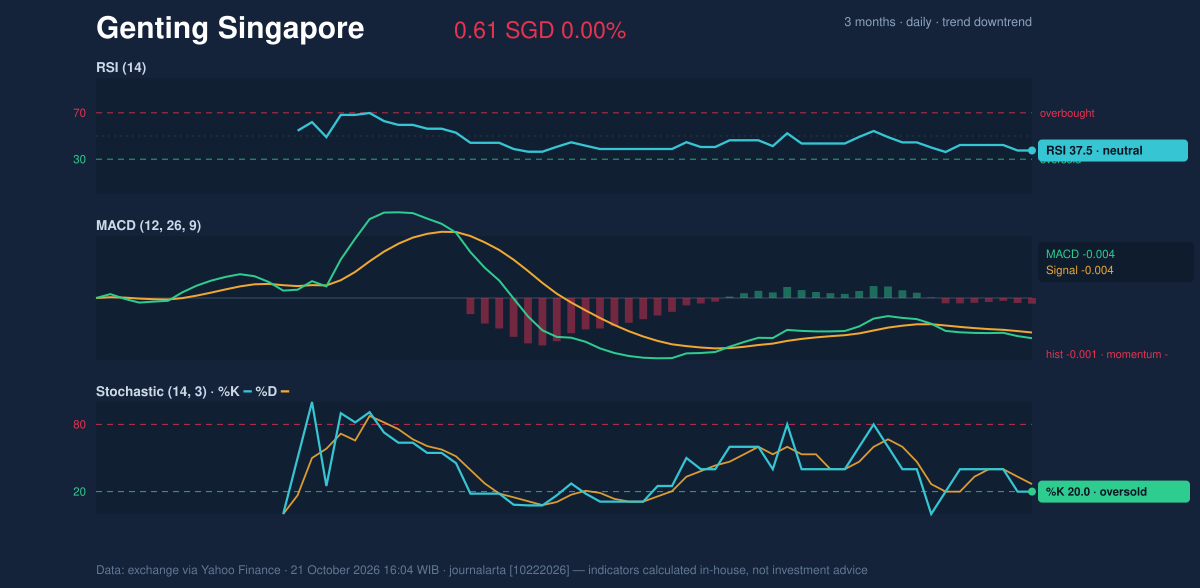
Volatility, Volume & Key Levels
The Bollinger bands are narrow, with a 3.8% width, while the price sits at just 11% of the band range. Narrow bands describe compressed recent movement and can precede a larger move, but they do not determine its direction. With ATR at SGD 0.01, or 1.8% of the share price, recent volatility is moderate. Trading participation is a caution. Volume was 6,884,400 shares, only 0.4 times the 20-day average of 17,035,595, and OBV was falling. OBV tracks whether volume tends to accompany rising or falling prices; its decline, alongside thin trading, offers little confirmation of accumulation. A break above SGD 0.63 would challenge the near-term downtrend, while a fall below SGD 0.60 would put the three-month low under pressure. A hold at SGD 0.60–0.61 without improving momentum would leave the stock vulnerable to continued range-bound weakness.Technical Verdict: HOLD
HOLD (wait & see) is the clearest technical reading: price is testing support, but the trend and volume signals have not confirmed a turn. - Reasons: the price remains below the SMA20 and SMA50, MACD momentum is negative, and falling OBV with thin volume weakens the case for a sustained rebound. Oversold Stochastic readings offer a counter-signal, not confirmation. - Ideal entry range: SGD 0.60–0.61, the three-month low and 20-day support area. - Exit target: SGD 0.63, the 20-day resistance and upper Bollinger band. - Stop-loss protection: below SGD 0.60, where the three-month floor would fail. - Invalidation: this HOLD verdict is invalidated if the price falls below SGD 0.60. For non-traders, the indicators show a share price near its floor, but not yet a convincing sign that the decline has ended.| Indicator | Reading |
|---|---|
| Last price | SGD 0.61 |
| SMA20 / SMA50 | SGD 0.61 / SGD 0.62 |
| Bollinger bands | SGD 0.60–0.63; width 3.8% |
| RSI / Stochastic | 37.5 / %K 20.0, %D 26.7 |
| MACD / histogram | -0.004 / -0.001 |
| Support / resistance | SGD 0.61 / SGD 0.63 |
| Volume / 20-day average | 6,884,400 / 17,035,595 |
Source: Exchange data via Yahoo Finance, as of 21 October 2026, 16:04 WIB. Technical analysis is not investment advice.
Why Genting Singapore is in focus today
- Closed at a 20-day low (0.61)
- Trading near its 3-month low (0.60)
Selected automatically from 16 SGX (Singapore) stocks by a technical-signal score with daily weighted randomisation — not a recommendation.
Summary Data Genting Singapore
| Last price | 0.61 SGD |
| Change 1 day / 5 days / 1 month | 0.00% / -0.82% / -2.42% |
| Trend / MA-cross | downtrend / none |
| SMA20 / SMA50 | 0.61 / 0.62 |
| RSI (14) / Stochastic %K | 37.5 / 20.0 |
| Bollinger %B / ATR | 11% / 0.01 |
| Support / Resistance 20 days | 0.61 / 0.63 |
| Data as of | 21 October 2026 16:04 WIB |
Disclaimer: This technical analysis is generated automatically from exchange data (via Yahoo Finance) and indicators calculated by JournalArta, for information and education only. The verdict and the entry, target and stop-loss levels are not investment advice or a solicitation to buy or sell any security. Investment decisions and their risks rest solely with the reader.
Track Genting Singapore share price daily: live levels, support/resistance and our full Genting Singapore analysis history.