AMAT Stock Technicals: Drops 8.16% on Thursday, RSI Oversold
On October 22, 2026: price 375.58 USD, trend sideways, RSI 25.2, support 375.58, resistance 542.28. technical analysis of amat stock. AMAT Stock Technicals —…
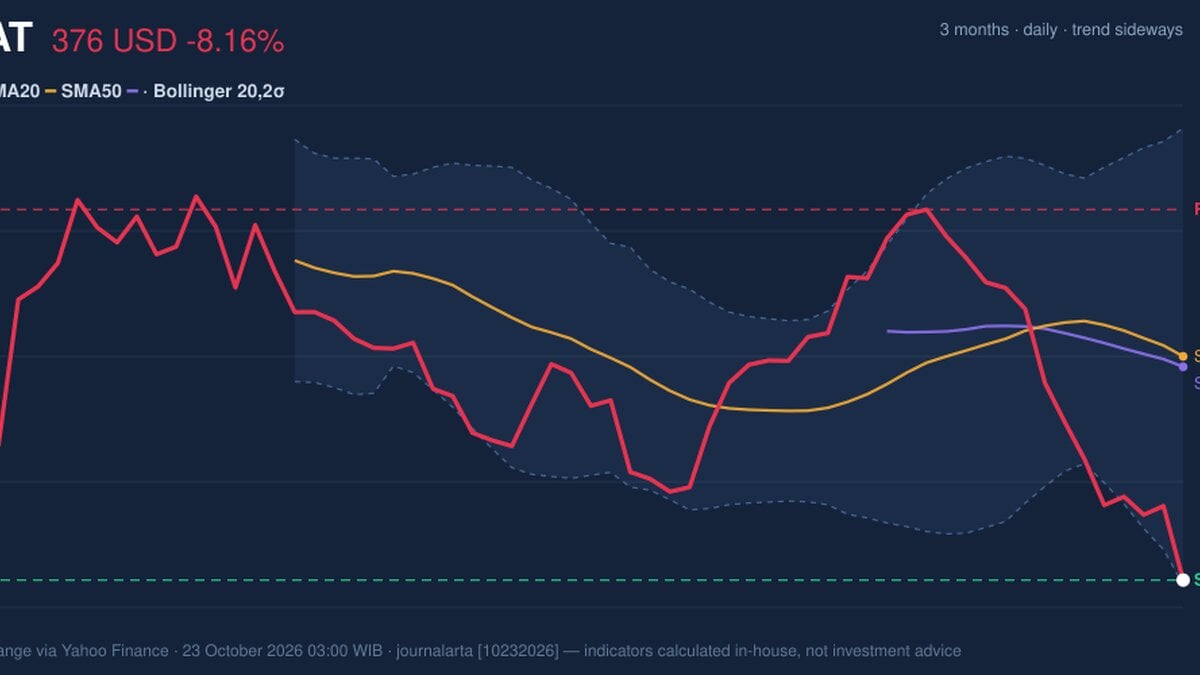
Why AMAT is in focus today
- One-day move of -8.16%, about 1.5× its average daily range (ATR)
- Volume at 1.9× the 20-day average
- Trading near its 3-month low (375.16)
- RSI(14) at 25.2 — oversold zone
Selected automatically from 32 NASDAQ (US) stocks by a technical-signal score with daily weighted randomisation — not a recommendation.
Trend & Price Action
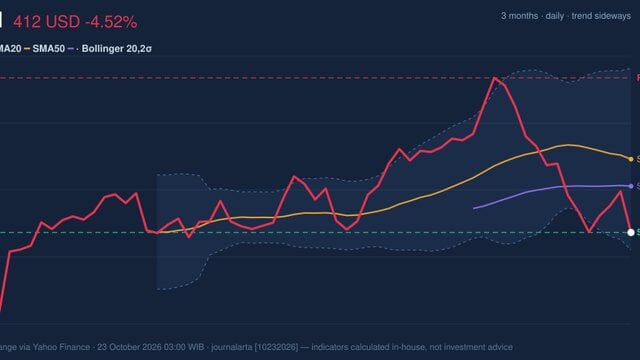
The stock is below both its 20-day simple moving average (SMA), at $476.23, and its 50-day SMA, at $471.56. A simple moving average tracks the average closing price over a set period; trading beneath both suggests recent weakness is broad rather than confined to a single session. The 20-day average is also falling, down 3.23% over five days. There is no new moving-average crossover, so the data show no fresh signal that a reversal has already taken hold. At $375.58, AMAT is almost at its three-month low of $375.16 and at the lower edge of the listed 20-day support range. The Bollinger lower band, a measure of price movement around an average, sits at $373.55. The close proximity of these levels makes them immediate areas to watch, but a support level is not a guarantee: a sustained move beneath it could indicate that selling pressure is still overpowering demand.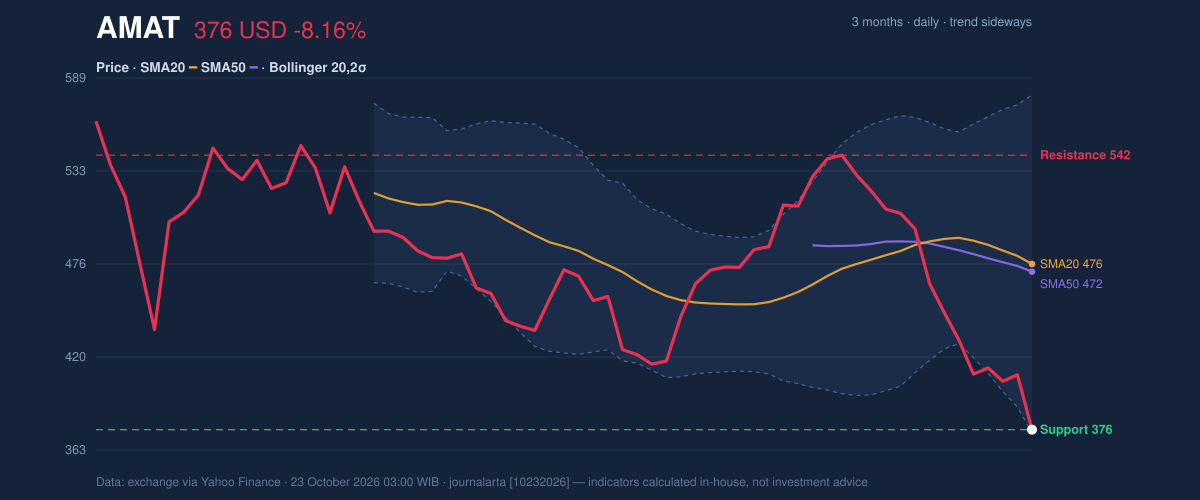
Oscillators & Momentum
Momentum indicators reinforce the picture of a severe sell-off, while stopping short of confirming a recovery. The RSI is 25.2, in oversold territory, and the Stochastic readings are also oversold, with %K at 0.2 and %D at 3.6. These indicators compare recent price moves to identify whether a decline has become unusually intense. Oversold readings can accompany a rebound, but they can persist when selling continues. The MACD remains negative at -22.782, below its signal line at -9.717, with a histogram of -13.065. The MACD compares faster- and slower-moving price averages; its negative reading indicates downward momentum, while the negative histogram shows that momentum has not yet turned positive. That weak confirmation matters: the oversold oscillators describe the extent of the decline, not a settled bottom.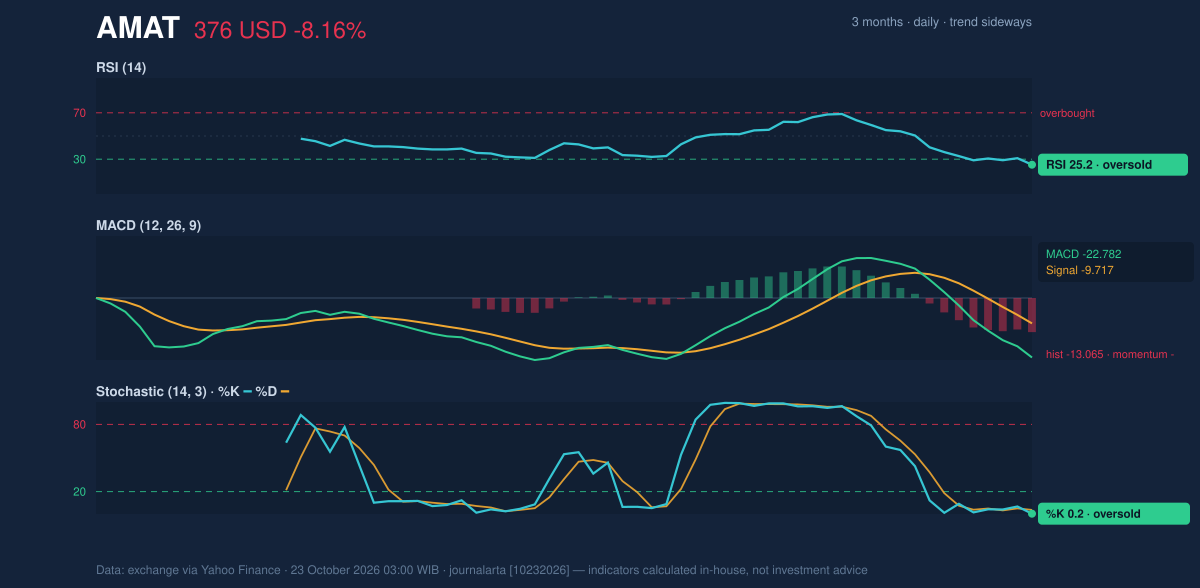
Key Levels & Scenarios
The immediate reference points are $375.16, the three-month low; $373.55, the lower Bollinger band; and $375.58, the listed 20-day support. The average true range (ATR), a measure of typical price movement, is $20.61, or 5.5% of the current price. That high reading helps explain why levels may be tested quickly and why single-session moves need to be interpreted in context. A hold above the recent low could ease immediate downside pressure, particularly if RSI and Stochastic begin to recover and MACD’s negative momentum narrows. A break below $373.55 would weaken that stabilizing case. Overhead, $471.56–$476.23, the 50- and 20-day averages, form a substantial resistance zone: a move back toward them would require a marked improvement from current levels. The listed 20-day resistance is $542.28.Technical Verdict: HOLD (wait & see)
The technical verdict is HOLD (wait & see). RSI and Stochastic are deeply oversold, but MACD remains negative; the price is below both major moving averages; and falling OBV with above-average volume points to persistent selling pressure. A move below $373.55 would invalidate the stabilizing case by taking AMAT beneath the lower Bollinger band and close to the three-month low. - Ideal Entry Range: $373.55–$375.58, only as a conditional technical zone near the lower band and listed support. - Exit Target (Target Price): $471.56–$476.23, the 50- and 20-day moving averages. - Stop Loss protection: Below $373.55, the lower Bollinger band. For non-traders, the signal is to wait for evidence that selling pressure is easing before treating the oversold readings as a durable turn.Summary Data AMAT
| Last price | 375.58 USD |
| Change 1 day / 5 days / 1 month | -8.16% / -12.66% / -20.81% |
| Trend / MA-cross | sideways / none |
| SMA20 / SMA50 | 476.23 / 471.56 |
| RSI (14) / Stochastic %K | 25.2 / 0.2 |
| Bollinger %B / ATR | 1% / 20.61 |
| Support / Resistance 20 days | 375.58 / 542.28 |
| Data as of | 23 October 2026 03:00 WIB |
Disclaimer: This technical analysis is generated automatically from exchange data (via Yahoo Finance) and indicators calculated by JournalArta, for information and education only. The verdict and the entry, target and stop-loss levels are not investment advice or a solicitation to buy or sell any security. Investment decisions and their risks rest solely with the reader.
Track AMAT stock price daily: live levels, support/resistance and our full AMAT analysis history.