COST Stock Technicals: Gains 1.99% on Thursday, RSI Overbought
On October 22, 2026: price 1,018.21 USD, trend uptrend, RSI 78.9, support 910.34, resistance 1,018.21. technical analysis of cost stock.
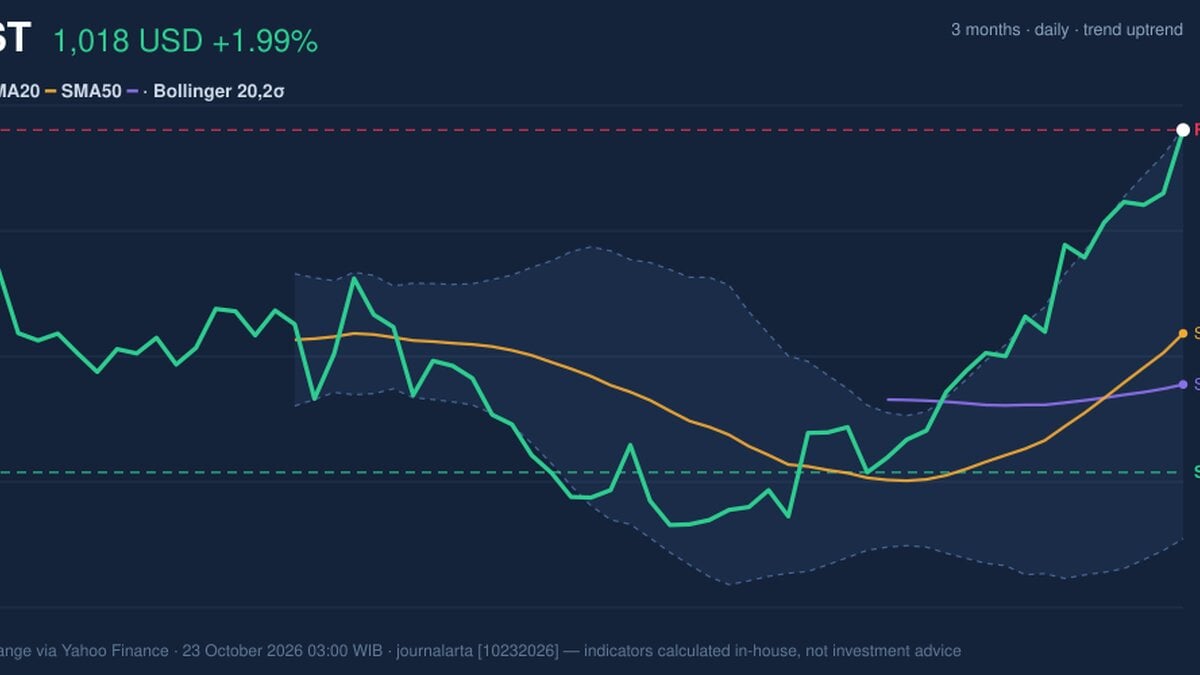
Trend & Price Action
Costco’s price is above both its 20-day simple moving average (SMA), at $954.12, and its 50-day SMA, at $938.04. The shorter average has crossed above the longer one, a pattern known as a golden cross. It can signal improving trend strength because recent prices are rising faster than the longer-term average, though it does not guarantee further gains. The 20-day average’s 2.70% rise over five days reinforces that upward bias. The latest close is only slightly below the three-month high of $1,018.86, and sits at the top of the 20-day range. Price has also reached the upper Bollinger Band at $1,018.81, with the band’s %B reading at 100%. Bollinger Bands track price relative to a moving average and its recent volatility; a touch of the upper band shows strong upward pressure, but can also mean the share price has moved unusually far from its recent average. The trend is strong, but Costco is pressing against the top of its recent range.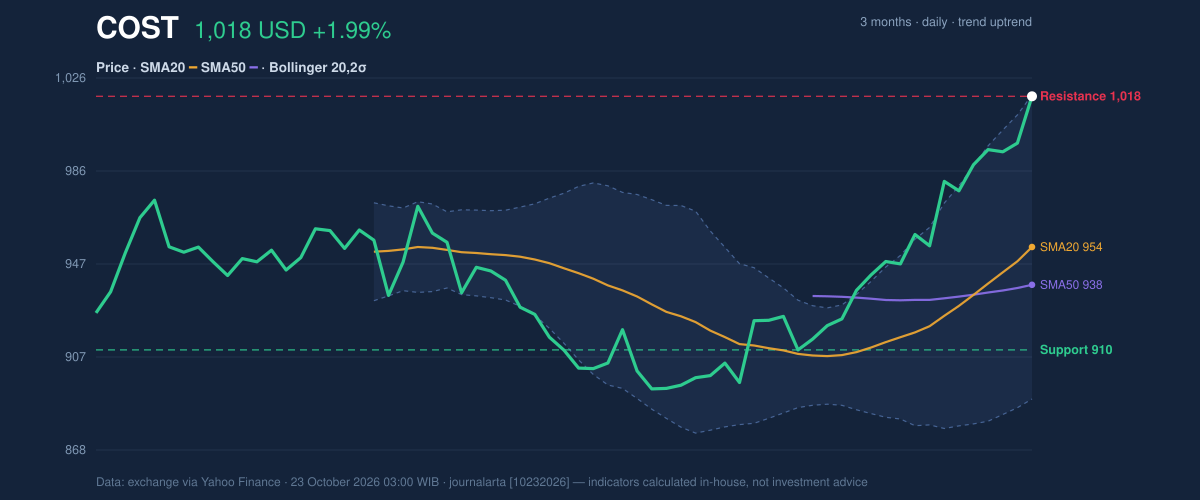
Oscillators & Momentum
Momentum measures broadly confirm the rise, while warning that it may be crowded. The RSI is 78.9, in overbought territory; the Stochastic readings are also overbought, at 99.4 for %K and 92.0 for %D. These indicators compare recent gains and losses or the closing price with its recent range. High readings can persist during a strong advance, but they also signal that a pause or pullback becomes more plausible if fresh buying fades. MACD, a trend-and-momentum measure, remains positive: its reading of 21.910 is above the 14.691 signal line, with a positive 7.218 histogram. This supports the bullish trend rather than showing a momentum reversal. The indicators therefore tell a mixed but coherent story: buyers remain in control, yet the rally is extended.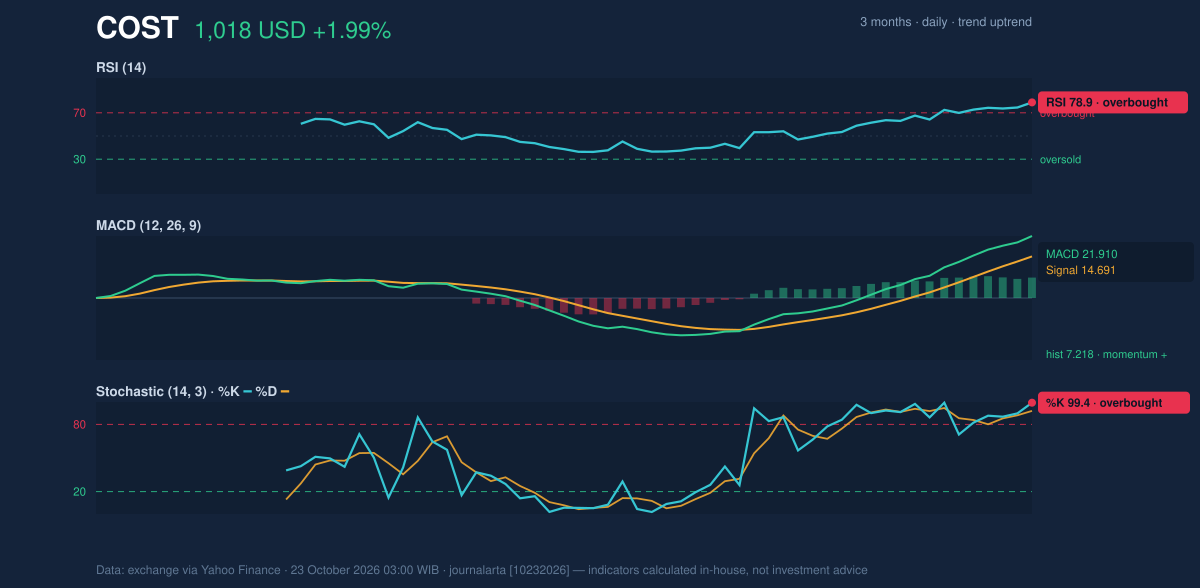
Volatility, Volume & Key Levels
Volume reached 2,837,400 shares, about 1.3 times the 20-day average of 2,250,060, while on-balance volume (OBV)—a running measure that adds volume on rising sessions and subtracts it on falling ones—was rising. That activity supports the price advance by showing participation, rather than a move made on unusually thin trading. The 14-day average true range, or ATR, is $15.82, equivalent to 1.6% of the share price, indicating moderate recent daily movement. The reported 20-day resistance is $1,018.21, the latest price, while the three-month high is $1,018.86. A sustained move above the three-month peak would put the stock beyond its recorded recent range; failure to hold the upper-band area could leave the moving averages as reference points for a pullback. The 20-day support is $910.34, with the 20-day SMA at $954.12 offering a nearer trend gauge. The support and resistance readings describe recent technical levels, not guaranteed floors or ceilings.Technical Verdict: HOLD (wait & see)
The technical picture leans upward, but a price at the top of its range alongside overbought RSI and Stochastic readings makes the near-term balance less clear. The golden cross, positive MACD and rising OBV argue that the advance has underlying support; the overbought readings and upper Bollinger Band counsel caution. This verdict would be invalidated if price falls below $910.34, the reported 20-day support.- Ideal entry range: $954.12–$1,018.21, bounded by the 20-day SMA and reported resistance.
- Exit target: $1,018.86, the three-month high and nearest stated level above the latest price.
- Stop-loss protection: $910.34, the reported 20-day support.
Costco’s reported three-month high is $1,018.86.
Why COST is in focus today
- One-day move of 1.99%, about 1.3× its average daily range (ATR)
- Trading near its 3-month high (1,018.86)
- Fresh golden cross: SMA20 crossed above SMA50
- RSI(14) at 78.9 — overbought zone
- Uptrend confirmed (5-day change 4.11%)
Selected automatically from 32 NASDAQ (US) stocks by a technical-signal score with daily weighted randomisation — not a recommendation.
Summary Data COST
| Last price | 1,018.21 USD |
| Change 1 day / 5 days / 1 month | 1.99% / 4.11% / 13.58% |
| Trend / MA-cross | uptrend / golden |
| SMA20 / SMA50 | 954.12 / 938.04 |
| RSI (14) / Stochastic %K | 78.9 / 99.4 |
| Bollinger %B / ATR | 100% / 15.82 |
| Support / Resistance 20 days | 910.34 / 1,018.21 |
| Data as of | 23 October 2026 03:00 WIB |
Disclaimer: This technical analysis is generated automatically from exchange data (via Yahoo Finance) and indicators calculated by JournalArta, for information and education only. The verdict and the entry, target and stop-loss levels are not investment advice or a solicitation to buy or sell any security. Investment decisions and their risks rest solely with the reader.
Track COST stock price daily: live levels, support/resistance and our full COST analysis history.