MRK Stock Analysis: Drops 1.76%, Death Cross Pressure
On October 22, 2026: price 147.24 USD, trend sideways, RSI 52.8, support 139.54, resistance 149.88. technical analysis of mrk stock. MRK Stock Analysis — full…
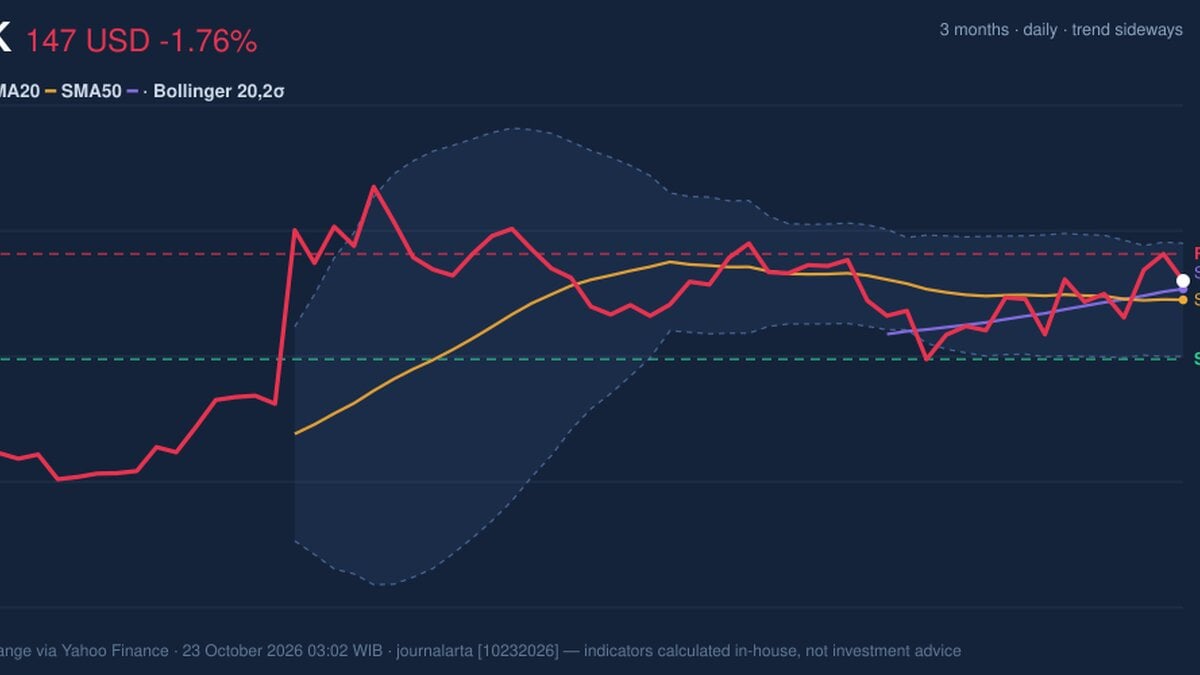
Why MRK is in focus today
- Volume at 2.0× the 20-day average
- Fresh death cross: SMA20 crossed below SMA50
Selected automatically from 30 NYSE (US) stocks by a technical-signal score with daily weighted randomisation — not a recommendation.
Trend & Price Action
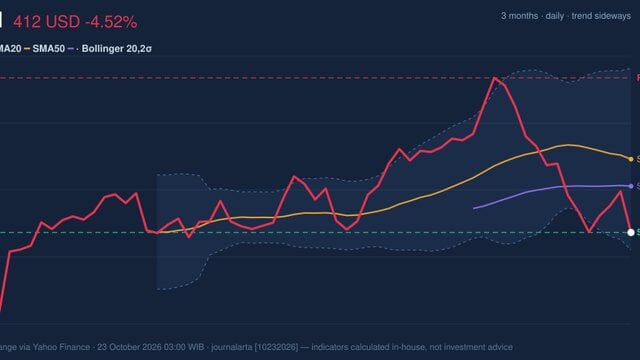
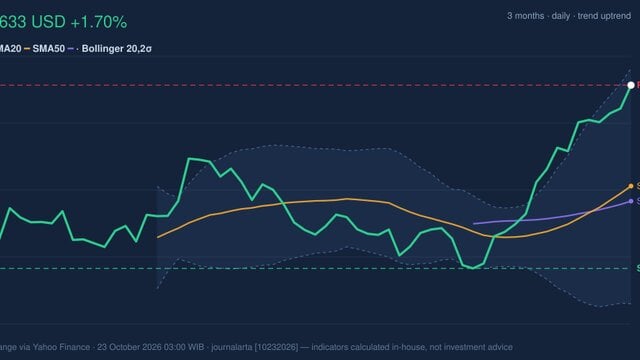
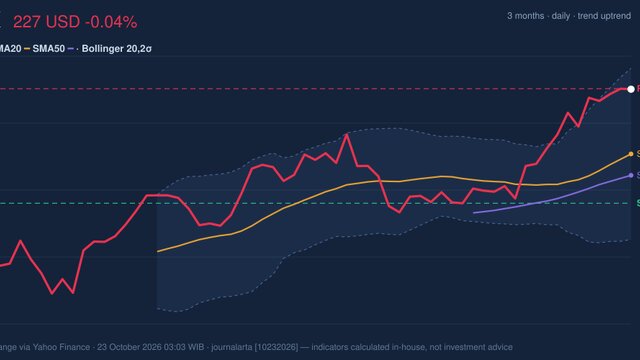
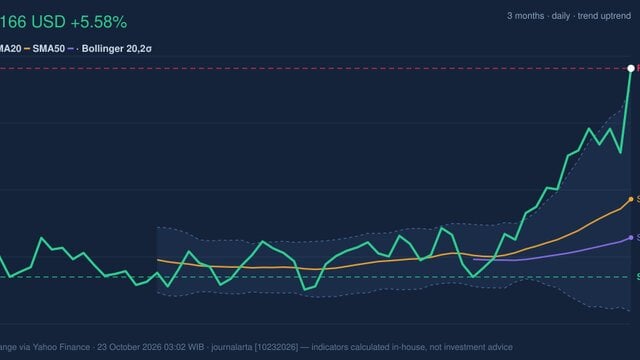
Merck is trading above its 20-day simple moving average (SMA) of $145.37, but just above its 50-day SMA of $146.45 only in the sense that the last price is slightly higher than both. The averages themselves tell a more cautious story: the 20-day line has crossed below the 50-day line, and its slope is falling 0.29% over five trading days. This leaves the broader picture sideways rather than decisively bearish, but the recent cross warns that the short-term trend has lost ground. The stock is 74% of the way through its 20-day range, between support at $139.54 and resistance at $149.88. It is also below its three-month high of $156.92 and above the three-month low of $126.22. That position near the top of the shorter range is a test: a sustained move through resistance would challenge the death-cross signal, while a retreat would suggest the recent range still holds. The price is near resistance, but the moving averages have turned against the near-term trend. As shown in the chart, the price sits above the Bollinger middle band and near the upper end of the recent range, while the two moving averages remain in a bearish cross.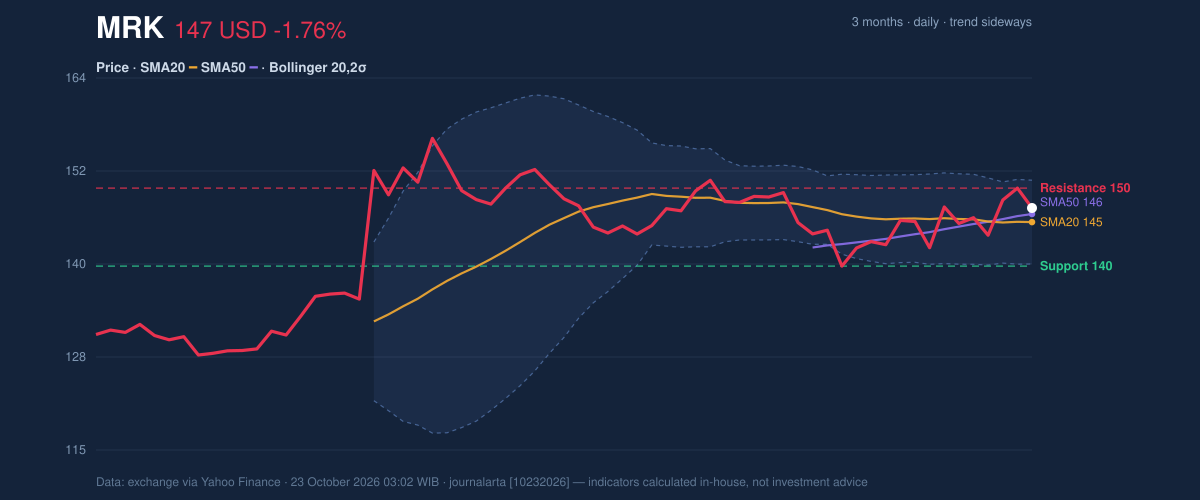
Oscillators & Momentum
Momentum indicators are mixed, not uniformly weak. The RSI is neutral at 52.8, a reading that indicates neither stretched buying nor selling pressure. The Stochastic oscillator is also in neutral territory, with %K at 55.5 below %D at 69.1; that gap suggests the faster measure of momentum has softened, although it does not establish a decisive reversal. MACD points in the other direction. Its line is at 0.516 against a signal line of 0.118, and the histogram is positive at 0.397. In plain terms, recent momentum remains positive by this measure even as the moving-average cross and the Stochastic comparison counsel caution. That divergence makes confirmation from price action more important than any single indicator. MACD is positive, while the neutral RSI and softer Stochastic reading offer no strong confirmation of a breakout. The momentum chart shows that split: MACD is above its signal line, but the other oscillators remain neutral rather than signaling forceful buying pressure.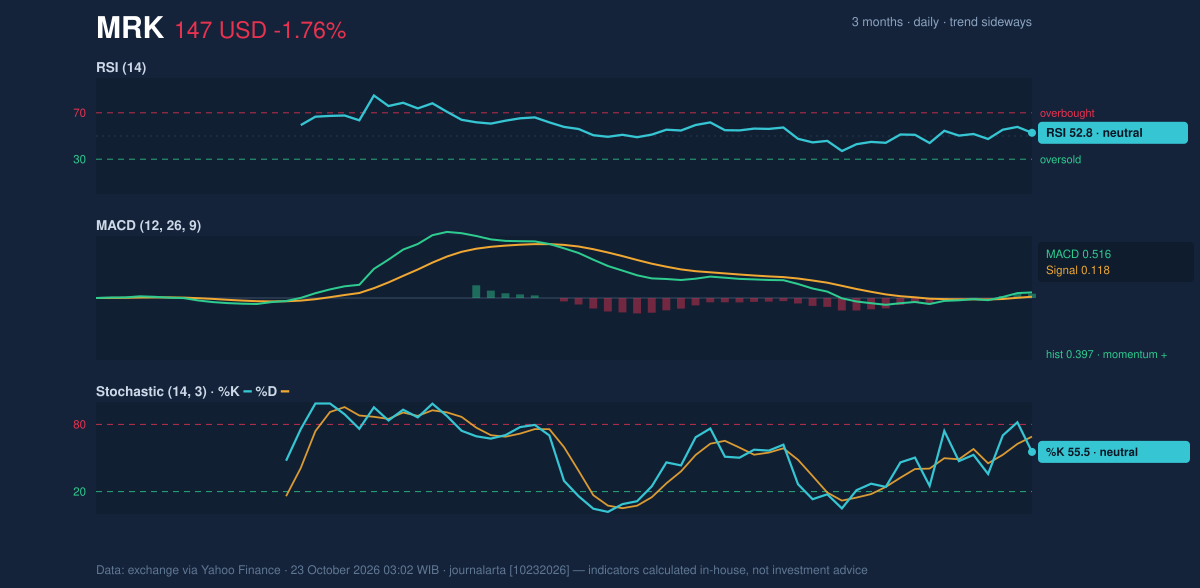
Volatility, Volume & Key Levels
The Bollinger bands are narrowing, with a 7.6% band width. Such a squeeze means recent price movement has become more compressed; it can precede a larger move, but does not predict its direction. Merck’s price is at 67% of the band’s range, between the middle band at $145.37 and the upper band at $150.92. The average true range, a measure of typical price movement, is $4.62, or 3.1% of the share price, indicating moderate volatility. The volume jump is notable, but OBV—the running balance of volume adjusted for whether trading days rise or fall—has declined. That combination means activity increased without confirming a sustained accumulation of shares by buyers. The latest session’s 19,024,600 shares traded, compared with a 20-day average of 9,661,225, therefore raises the stakes without settling the direction. $149.88 is the near-term resistance to watch; $139.54 is the key support if the range breaks lower. A move above resistance would put the upper Bollinger band at $150.92 in view. If the shares fail to hold the $145.37 middle band, support at $139.54 becomes more significant.Technical Verdict: HOLD (wait & see)
The indicators support a neutral technical verdict: the positive MACD and price above both SMAs argue against a clearly bearish reading, but the new death cross, falling OBV and lack of strong oscillator confirmation argue against a clearly bullish one. The verdict is invalidated if the price falls below $139.54, the 20-day support level.- Ideal entry range: $145.37–$146.45, around the 20-day and 50-day SMAs.
- Exit target: $149.88–$150.92, spanning 20-day resistance and the upper Bollinger band.
- Stop-loss protection: $139.54, at 20-day support.
| Indicator | Reading |
|---|---|
| Last price | $147.24 |
| Daily change | -1.76% |
| SMA20 / SMA50 | $145.37 / $146.45; death cross |
| RSI(14) | 52.8, neutral |
| Stochastic | %K 55.5 / %D 69.1, neutral |
| MACD / signal / histogram | 0.516 / 0.118 / 0.397 |
| Support / resistance | $139.54 / $149.88 |
| Volume | 19,024,600; 2.0× 20-day average |
Summary Data MRK
| Last price | 147.24 USD |
| Change 1 day / 5 days / 1 month | -1.76% / 1.41% / -0.50% |
| Trend / MA-cross | sideways / death |
| SMA20 / SMA50 | 145.37 / 146.45 |
| RSI (14) / Stochastic %K | 52.8 / 55.5 |
| Bollinger %B / ATR | 67% / 4.62 |
| Support / Resistance 20 days | 139.54 / 149.88 |
| Data as of | 23 October 2026 03:02 WIB |
Disclaimer: This technical analysis is generated automatically from exchange data (via Yahoo Finance) and indicators calculated by JournalArta, for information and education only. The verdict and the entry, target and stop-loss levels are not investment advice or a solicitation to buy or sell any security. Investment decisions and their risks rest solely with the reader.
Track MRK stock price daily: live levels, support/resistance and our full MRK analysis history.