MSTR Stock Analysis: Drops 5.00%, Momentum Weakens
On October 22, 2026: price 145.80 USD, trend sideways, RSI 49.5, support 136.02, resistance 164.55. technical analysis of mstr stock. MSTR Stock Analysis —…
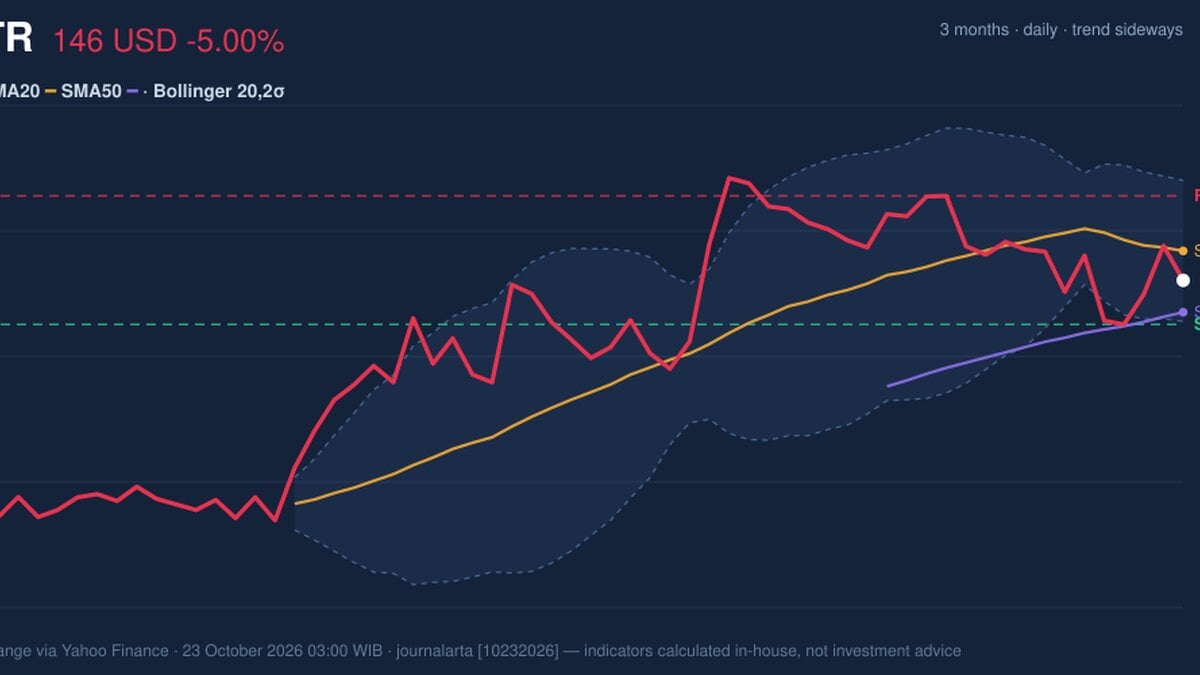
Strategy fell 5.00% to $145.80 on Nasdaq as of October 23, with the stock below its 20-day average and short-term momentum weakening. The decline stood out against a sideways broader trend: trading volume was above its 20-day average, while the on-balance volume measure fell, suggesting that recent participation has not confirmed strength. The signals make MSTR worth watching, but they do not point to a clear directional trend.
Trend & Price Action
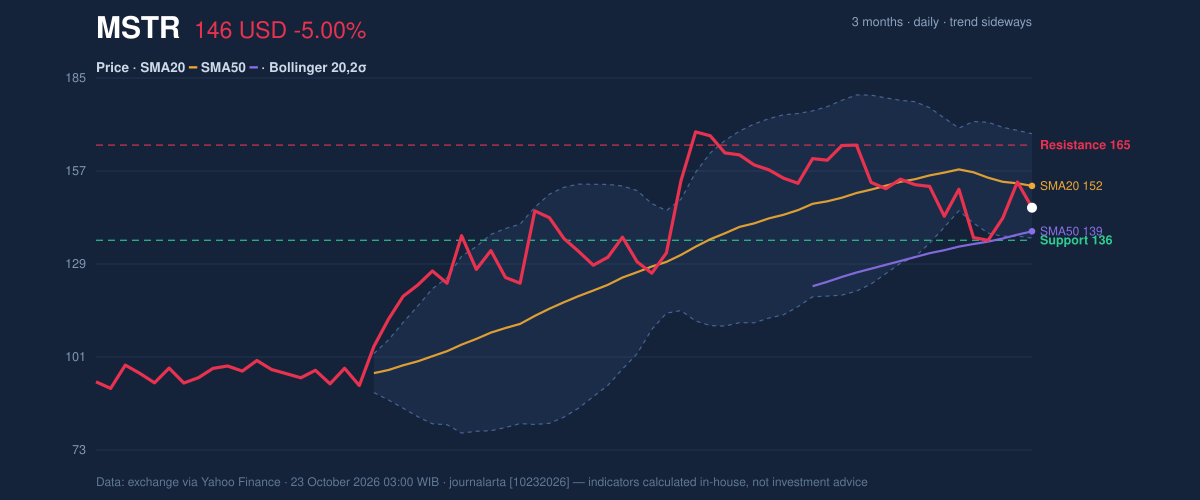
At $145.80, MSTR is below its SMA20 of $152.32 but above its SMA50 of $138.72. The short-term average’s 3.14% decline over five days shows near-term pressure, while the price holding above the 50-day average leaves the intermediate trend less clearly bearish. There has been no new moving-average crossover, so the averages are not yet signaling a fresh trend change.
The stock has lost 3.63% over five days and 9.78% over a month. Its position at 34% of the 20-day range places it closer to support than resistance, but not at the range’s low. In the three-month span, MSTR has traded between $89.21 and $171.19, a wide range that underscores how sharply sentiment can shift.
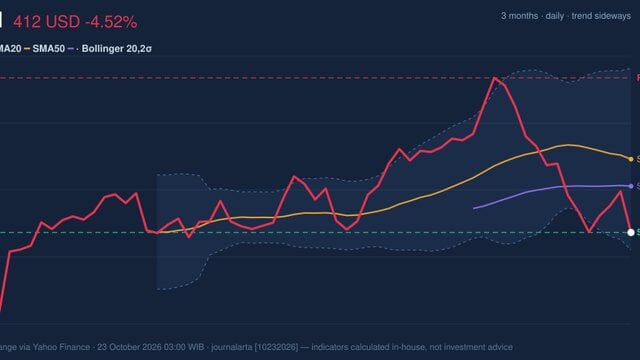
As shown in the chart, the price is below the Bollinger middle band at $152.32 and nearer the lower band at $136.69. The Bollinger %B reading of 29% places it in the lower portion of the band, but not at the extreme; the bands are widening, indicating elevated volatility rather than a settled trading range.
Oscillators & Momentum
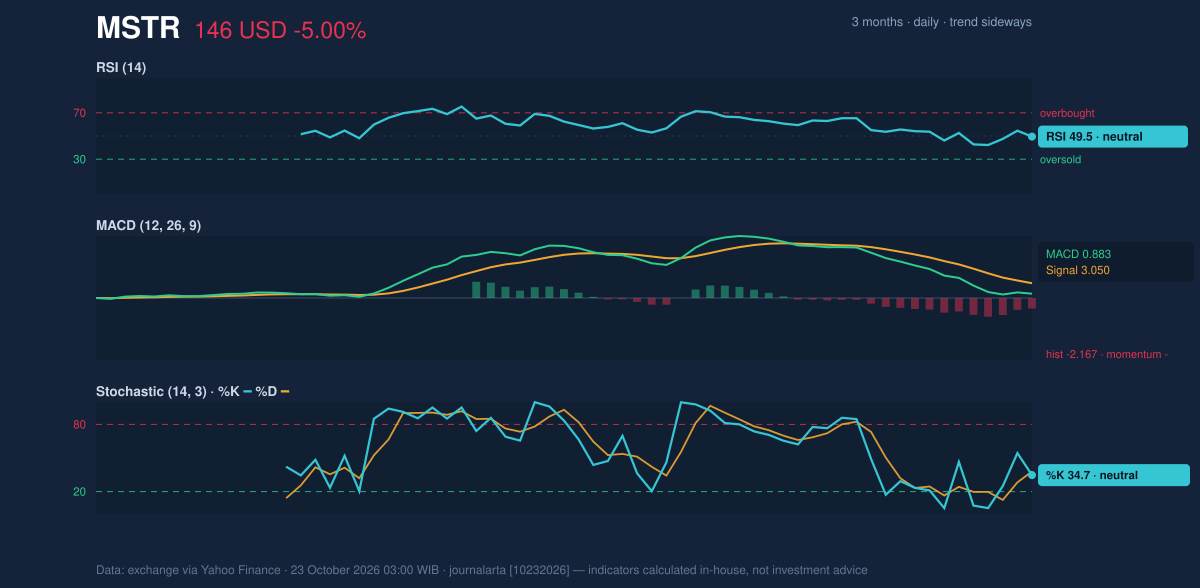
Momentum readings are mixed, not uniformly oversold. The RSI is neutral at 49.5, close to the midpoint that separates stronger from weaker recent price momentum. The Stochastic readings are also neutral, with %K at 34.7 and %D at 38.0. Their proximity suggests no strong momentum turn is yet established.
The MACD gives the clearest warning: its histogram is negative at -2.167, with the MACD at 0.883 below its 3.050 signal line. In plain language, recent downward momentum is stronger than the signal line’s pace, even though the RSI has not entered an oversold reading. That divergence makes a rebound possible, but not confirmed by these indicators.
Volatility, Volume & Key Levels
The 14-day average true range, a measure of typical daily movement, is $9.71, or 6.7% of the share price. Together with widening Bollinger bands, that reading means price swings are large enough to make nearby levels less reliable as precise turning points.
Volume reached 20,538,200 shares, about 1.1 times the 20-day average of 19,350,390. That is a modest increase, not an exceptional surge. More importantly, OBV—the running tally of volume associated with rising or falling sessions—declined. The combination suggests selling pressure has had some participation, but the volume data alone does not establish a decisive breakdown.
The nearest reference points are 20-day support at $136.02 and 20-day resistance at $164.55. A sustained move above the $152.32 SMA20 would improve the short-term picture; clearing resistance at $164.55 would offer stronger evidence of renewed strength. If support at $136.02 fails, the price would be below both the 50-day average and the lower Bollinger band, weakening the technical setup. These are conditional scenarios, not predictions.
Technical Verdict: HOLD (wait & see)
The technical verdict is HOLD (wait & see), based on a mixed structure rather than a confirmed reversal. The reasons are the price’s position below the falling SMA20, the negative MACD histogram, and declining OBV despite above-average volume. Neutral RSI and Stochastic readings, plus the price remaining above the SMA50, argue against treating the weakness as an already-confirmed breakdown.
- Illustrative entry range: $138.72–$152.32, bounded by the SMA50 and SMA20.
- Illustrative exit target: $164.55, the 20-day resistance level.
- Illustrative stop-loss protection: $136.02, the 20-day support level.
The verdict is invalidated if the price falls below $136.02. For non-traders, the indicators show a share price under short-term pressure but not yet a confirmed break beneath its key support.
Source: Nasdaq market data via Yahoo Finance, as of October 23, 2026, 03:00 WIB.
Summary Data MSTR
| Last price | 145.80 USD |
| Change 1 day / 5 days / 1 month | -5.00% / -3.63% / -9.78% |
| Trend / MA-cross | sideways / none |
| SMA20 / SMA50 | 152.32 / 138.72 |
| RSI (14) / Stochastic %K | 49.5 / 34.7 |
| Bollinger %B / ATR | 29% / 9.71 |
| Support / Resistance 20 days | 136.02 / 164.55 |
| Data as of | 23 October 2026 03:00 WIB |
Disclaimer: This technical analysis is generated automatically from exchange data (via Yahoo Finance) and indicators calculated by JournalArta, for information and education only. The verdict and the entry, target and stop-loss levels are not investment advice or a solicitation to buy or sell any security. Investment decisions and their risks rest solely with the reader.
Track MSTR stock price daily: live levels, support/resistance and our full MSTR analysis history.