Rolls-Royce Stock Analysis: Drops 7.57%, RSI Oversold
On October 23, 2026: price 1,164.20 GBp, trend downtrend, RSI 19.2, support 1,164.20, resistance 1,481.20. technical analysis of rolls-royce stock.
Why Rolls-Royce is in focus today
- One-day move of -7.57%, about 1.5× its average daily range (ATR)
- Volume at 1.8× the 20-day average
- Trading near its 3-month low (1,158.60)
- RSI(14) at 19.2 — oversold zone
- Downtrend extending (5-day change -13.80%)
Selected automatically from 16 LSE (UK) stocks by a technical-signal score with daily weighted randomisation — not a recommendation.
Trend & Price Action
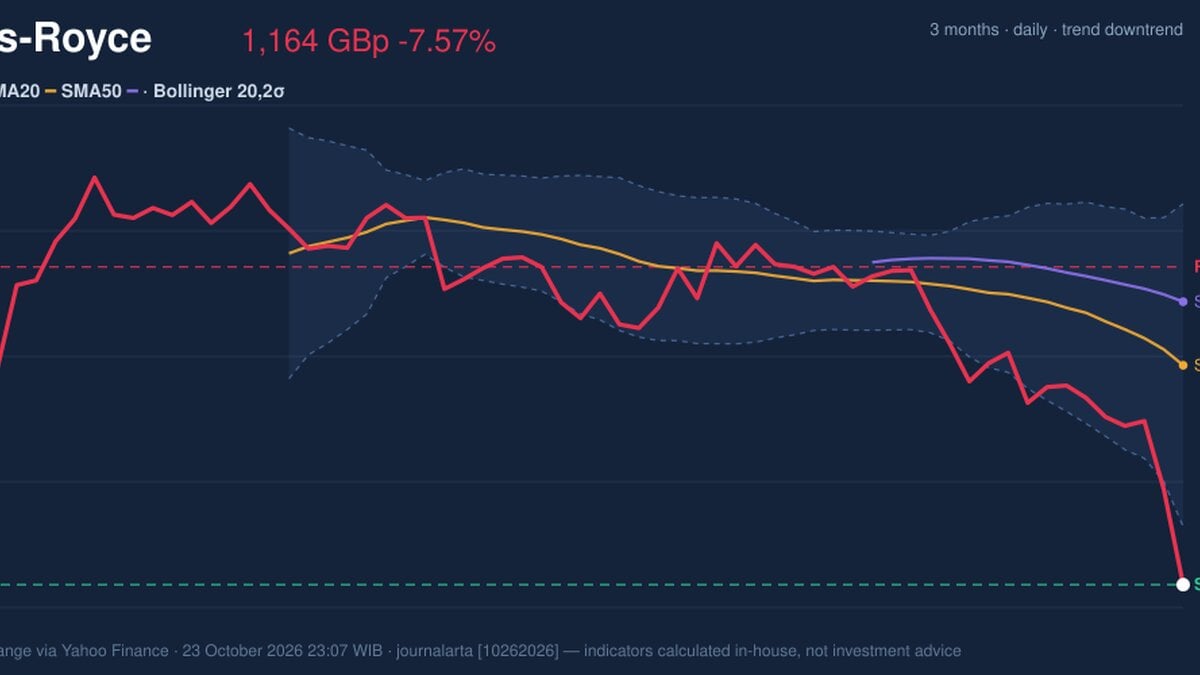
The shares are in a downtrend, down 13.80% over five trading days and 21.41% over one month. At 1,164.20 GBp, the price is well below the 20-day simple moving average (SMA) of 1,383.02 and the 50-day SMA of 1,446.54. A simple moving average tracks the mean closing price over a set period; trading beneath both suggests recent weakness is broad rather than limited to a single session. The 20-day average is also falling at 3.66% over five days. There has been no new crossover between the averages, so the signal is one of sustained downward pressure rather than a fresh technical trigger. The share price is at the bottom of its stated 20-day range, with resistance at 1,481.20 GBp. It is also close to the three-month low of 1,158.60 GBp. The 20-day support is 1,164.20 GBp, but a support level is a potential area where selling may ease, not a guarantee that it will. The price is below the lower Bollinger Band at 1,221.97 GBp, with %B at -18%. Bollinger Bands measure how far a price has moved relative to its recent average and volatility; a reading below the lower band marks unusually weak positioning, but does not by itself establish a reversal.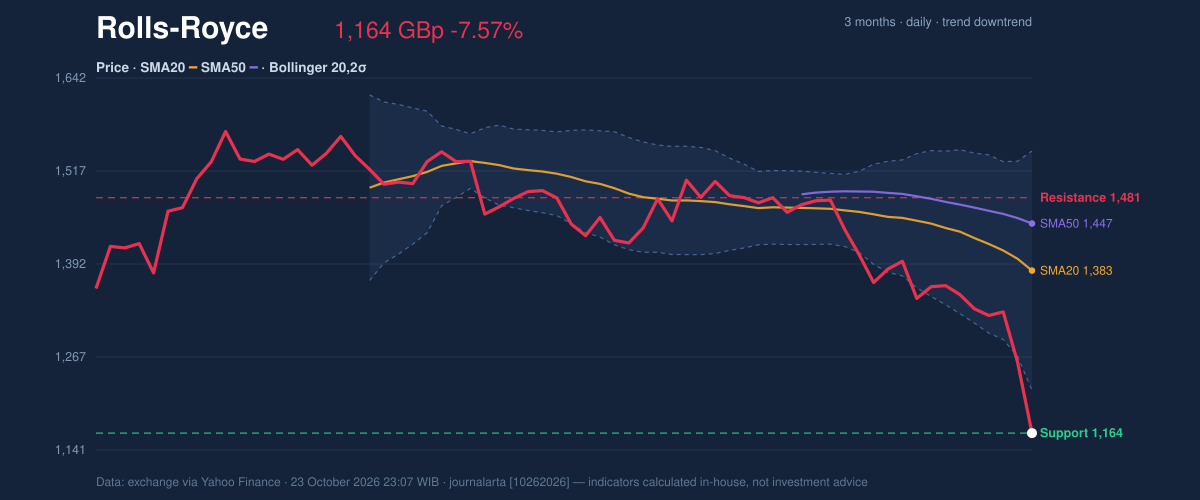
Oscillators & Momentum
Short-term momentum is deeply negative. The RSI is 19.2, in oversold territory, while Stochastic %K at 1.4 and %D at 4.7 are also oversold. These measures compare recent price movements to identify unusually persistent buying or selling. Such readings can precede a bounce, but they can also remain depressed while a downtrend continues. The MACD reinforces that caution: its reading is -55.064, below the -36.392 signal line, with a negative histogram of -18.673. MACD compares moving averages to gauge the direction and strength of momentum. Here, it points to continuing downside pressure rather than a confirmed turn. Oversold oscillators and negative MACD are therefore in tension: the selling looks stretched, but the trend signal has not reversed.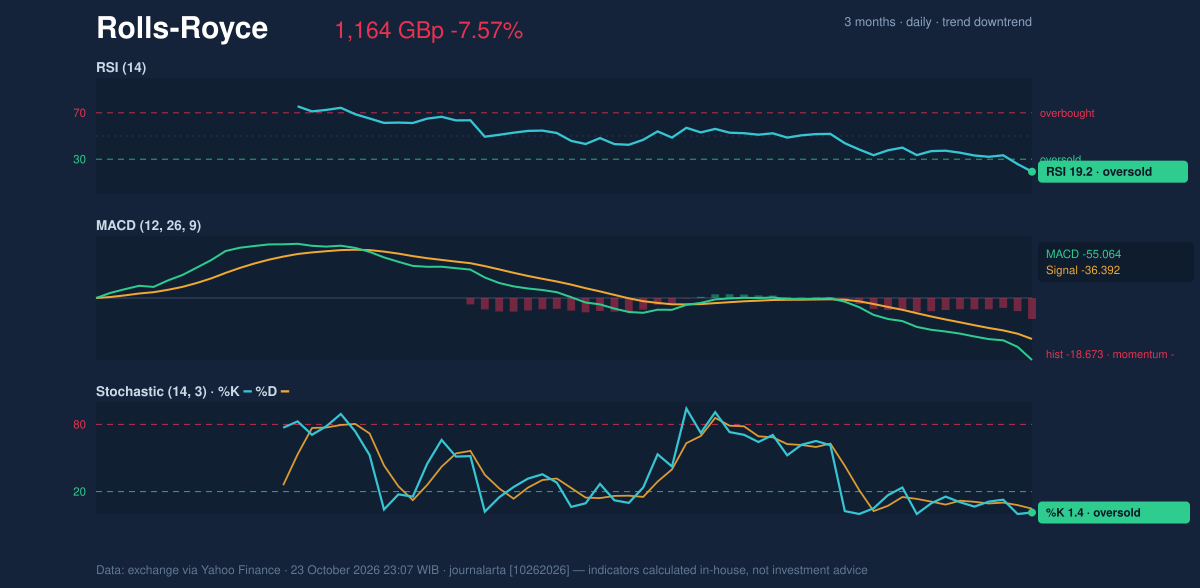
Volatility & Volume
The Bollinger Band width is 23.3% and widening, while ATR is 58.85 GBp, or 5.1% of the last price. ATR estimates the typical size of price moves; at that level, daily swings are large relative to the share price. Widening bands similarly indicate increased volatility, so a move away from the current area may be sharper than during calmer trading. Volume reached 40,179,078 shares against a 20-day average of 22,610,570. That surge confirms heavy activity during the fall, but the declining OBV (on-balance volume, a measure that relates volume to price direction) offers no evidence that buying pressure is accumulating. High volume alongside falling OBV makes the sell-off harder to dismiss as a thin-market fluctuation.Technical Verdict: HOLD (wait & see)
The technical picture is mixed only in the limited sense that oversold readings could allow a rebound; the prevailing evidence remains weak. The price is below both moving averages, MACD remains negative, and the volume surge coincided with a sharp decline. RSI and Stochastic are oversold, but neither has confirmed a reversal. - Ideal Entry Range: 1,164.20–1,221.97 GBp, bounded by the stated 20-day support and lower Bollinger Band; any move into this range would still require evidence that selling pressure is easing. - Exit Target (Target Price): 1,383.02–1,481.20 GBp, from the 20-day SMA to the stated 20-day resistance. - Stop Loss: Below 1,158.60 GBp, the three-month low; a break beneath that level would indicate a fresh deterioration in price structure. - Invalidation: This HOLD verdict is invalidated if the price breaks below 1,158.60 GBp. For non-traders, HOLD means the indicators show a steep decline and possible short-term exhaustion, but not yet a reliable sign that the fall has turned.Data
Market data: exchange figures via Yahoo Finance, as of 23 October 2026, 23:07 WIB.Summary Data Rolls-Royce
| Last price | 1,164.20 GBp |
| Change 1 day / 5 days / 1 month | -7.57% / -13.80% / -21.41% |
| Trend / MA-cross | downtrend / none |
| SMA20 / SMA50 | 1,383.02 / 1,446.54 |
| RSI (14) / Stochastic %K | 19.2 / 1.4 |
| Bollinger %B / ATR | -18% / 58.85 |
| Support / Resistance 20 days | 1,164.20 / 1,481.20 |
| Data as of | 23 October 2026 23:07 WIB |
Disclaimer: This technical analysis is generated automatically from exchange data (via Yahoo Finance) and indicators calculated by JournalArta, for information and education only. The verdict and the entry, target and stop-loss levels are not investment advice or a solicitation to buy or sell any security. Investment decisions and their risks rest solely with the reader.
Track Rolls-Royce share price daily: live levels, support/resistance and our full Rolls-Royce analysis history.