Shell RSI Overbought: Stock Gains 3.72% (October 23, 2026)
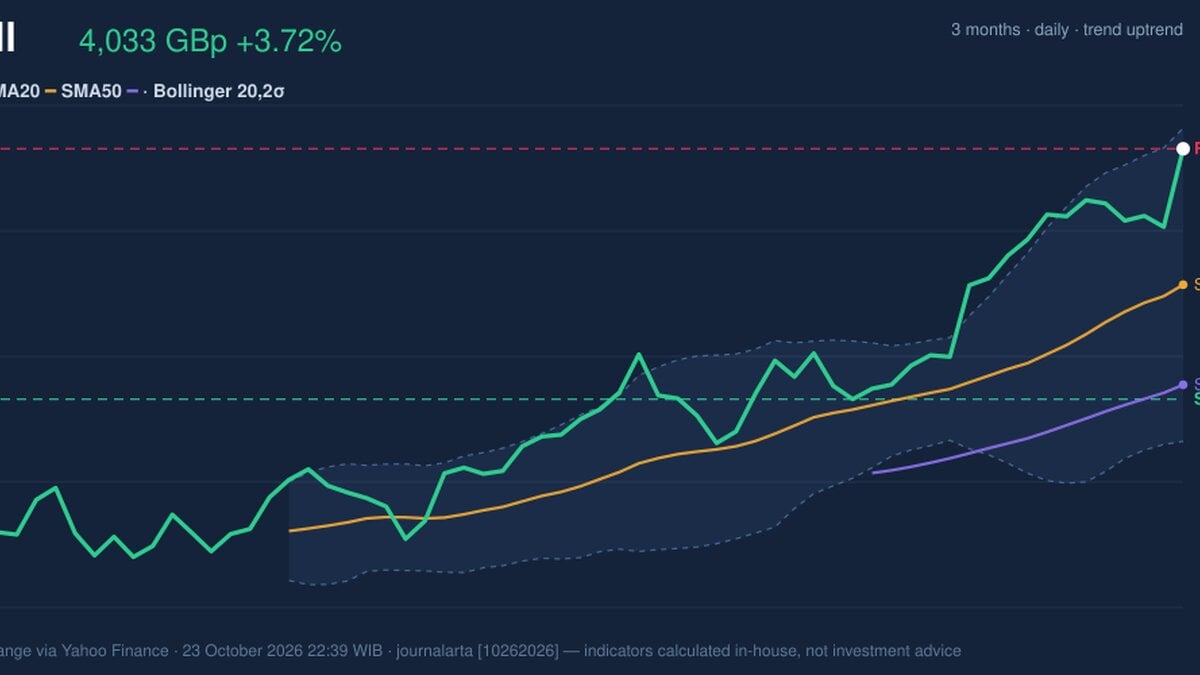
On October 23, 2026: price 4,033.00 GBp, trend uptrend, RSI 77.3, support 3,569.50, resistance 4,033.00. technical analysis of shell stock.
Why Shell is in focus today
- One-day move of 3.72%, about 1.8× its average daily range (ATR)
- Closed at a 20-day high (4,033.00)
- Trading near its 3-month high (4,035.50)
- RSI(14) at 77.3 — overbought zone
- Uptrend confirmed (5-day change 2.41%)
Selected automatically from 16 LSE (UK) stocks by a technical-signal score with daily weighted randomisation — not a recommendation.
Trend & Price Action
Shell is trading above both its 20-day simple moving average (SMA20) of 3,781.48 and its 50-day average of 3,596.27. The SMA20 has climbed 2.48% over five days, pointing to strengthening short-term price structure. There has been no recent moving-average crossover, so the evidence is a rising trend rather than a newly formed technical signal. The shares closed at 4,033.00 GBp, just below the three-month high of 4,035.50 and at the top of the 20-day range. That positioning shows buyers have driven the price to a meaningful test: a sustained move above the recent high would extend the breakout, while failure to hold near the peak could bring a pullback toward moving-average support. The upper Bollinger Band is 4,071.33, placing the latest price near the band’s ceiling; the %B reading of 93% confirms that price is near the upper edge of its recent range. The bands are not unusually narrow or wide, with a normal width of 15.3%, so the setup does not signal a volatility squeeze. Instead, it shows a strong advance that is already stretched against its recent trading envelope.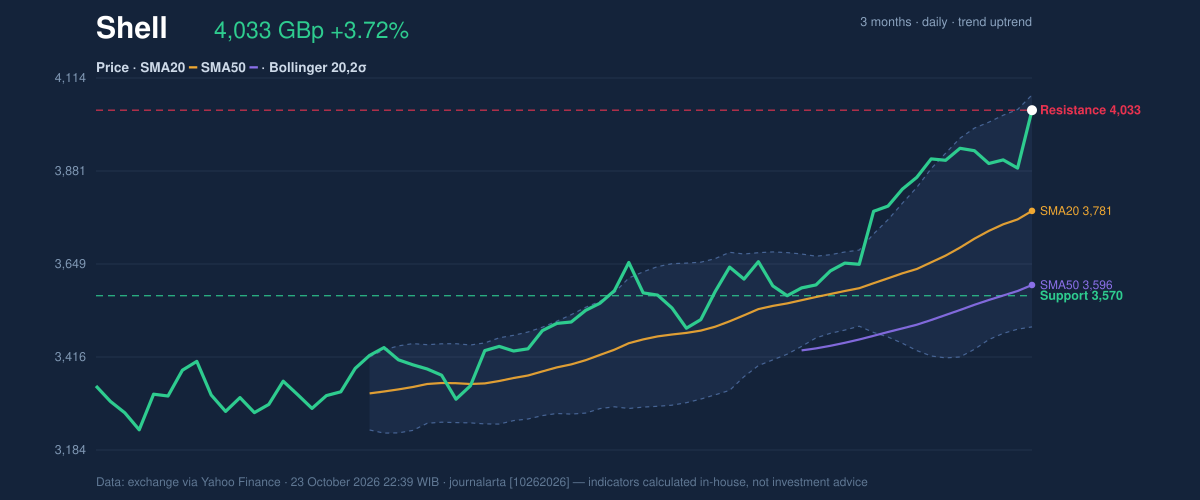
Oscillators & Momentum
Momentum indicators broadly confirm the upward move, but they also warn that the rally may be running hot. RSI is 77.3, in overbought territory, while Stochastic %K at 99.4 and %D at 86.5 are also overbought. These readings do not by themselves predict a reversal; they indicate that buying has been strong enough to leave the shares vulnerable to a pause or a sharper reaction to selling. MACD remains constructive: the MACD line at 110.124 is above its 99.501 signal line, and the positive histogram of 10.623 shows upward momentum is still in place. The combination matters: the trend has momentum behind it, but elevated RSI and Stochastic readings make further gains less secure unless buyers continue to participate.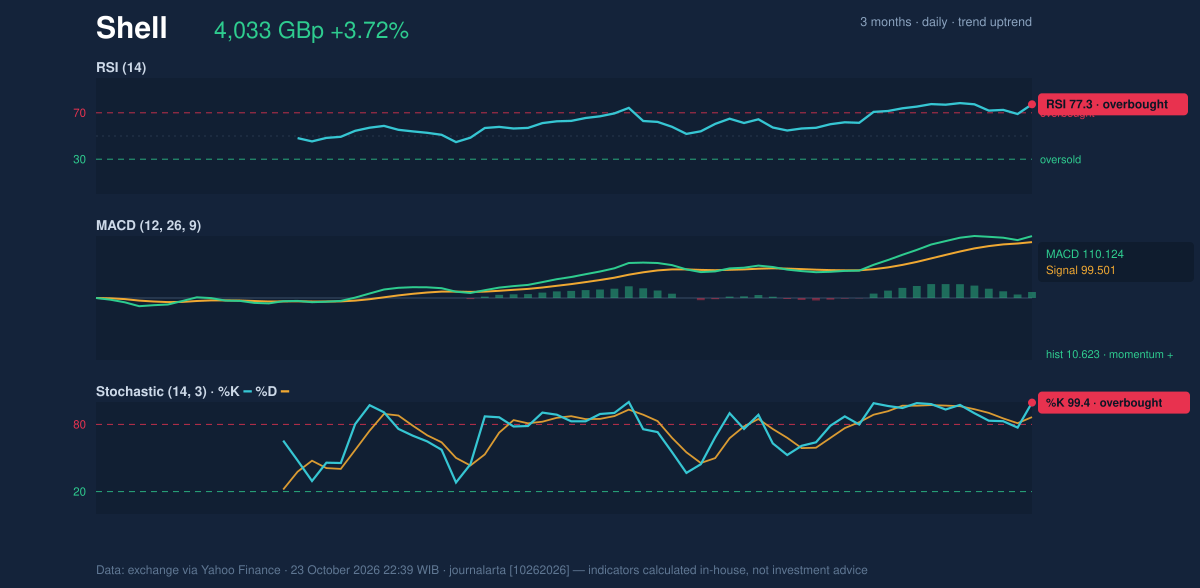
Volatility, Volume & Key Levels
Shell’s average true range, a measure of typical price movement, is 83.14 GBp, or 2.1% of the share price—consistent with moderate volatility. The latest one-day rise was unusually large relative to that measure, highlighting the force of the session without implying that similar moves will continue. Trading volume was 6,701,597 shares, about 0.7 times the 20-day average of 9,454,768. That is a qualification to the breakout: the price rose strongly, but participation was thinner than usual. On the other hand, on-balance volume (OBV), which tracks whether volume tends to accompany rising or falling prices, is rising. This supports the broader advance, though it does not erase the caution from the latest session’s lighter turnover. Resistance is 4,033.00 GBp, the current 20-day range ceiling, with the three-month high at 4,035.50 close overhead. A clear move beyond that area would show the shares overcoming nearby supply. Support sits at 3,569.50 GBp; before that, the SMA20 at 3,781.48 is a nearer reference point for whether the short-term uptrend is holding. A fall below the 20-day support would materially weaken the technical picture.Technical Verdict: HOLD (wait & see)
The technical balance favors patience rather than treating the latest surge as an unambiguous continuation signal. The rising SMA20 and price above both moving averages support the trend; positive MACD and rising OBV add confirmation. But RSI and Stochastic are overbought, and the share price is pressing against resistance on below-average volume. - Ideal entry range: 3,781.48–4,033.00 GBp, bounded by the SMA20 and current resistance. - Exit target: 4,071.33 GBp, the upper Bollinger Band. - Stop-loss protection: 3,569.50 GBp, the 20-day support. - Invalidation: The HOLD verdict is invalidated if price falls below 3,569.50 GBp. In plain English, Shell’s trend is rising, but stretched momentum and a nearby ceiling make confirmation important. One detail stands out in the latest data: the shares reached their 20-day high even as volume remained below its normal level.Summary Data Shell
| Last price | 4,033.00 GBp |
| Change 1 day / 5 days / 1 month | 3.72% / 2.41% / 11.69% |
| Trend / MA-cross | uptrend / none |
| SMA20 / SMA50 | 3,781.48 / 3,596.27 |
| RSI (14) / Stochastic %K | 77.3 / 99.4 |
| Bollinger %B / ATR | 93% / 83.14 |
| Support / Resistance 20 days | 3,569.50 / 4,033.00 |
| Data as of | 23 October 2026 22:39 WIB |
Disclaimer: This technical analysis is generated automatically from exchange data (via Yahoo Finance) and indicators calculated by JournalArta, for information and education only. The verdict and the entry, target and stop-loss levels are not investment advice or a solicitation to buy or sell any security. Investment decisions and their risks rest solely with the reader.
Track Shell share price daily: live levels, support/resistance and our full Shell analysis history.