China Mobile Stock Technicals: Gains 1.91% on Friday, Testing Key Resistance
On October 30, 2026: price 80.00 HKD, trend sideways, RSI 56.4, support 77.10, resistance 81.00. technical analysis of china mobile stock.
Trend & Price Action
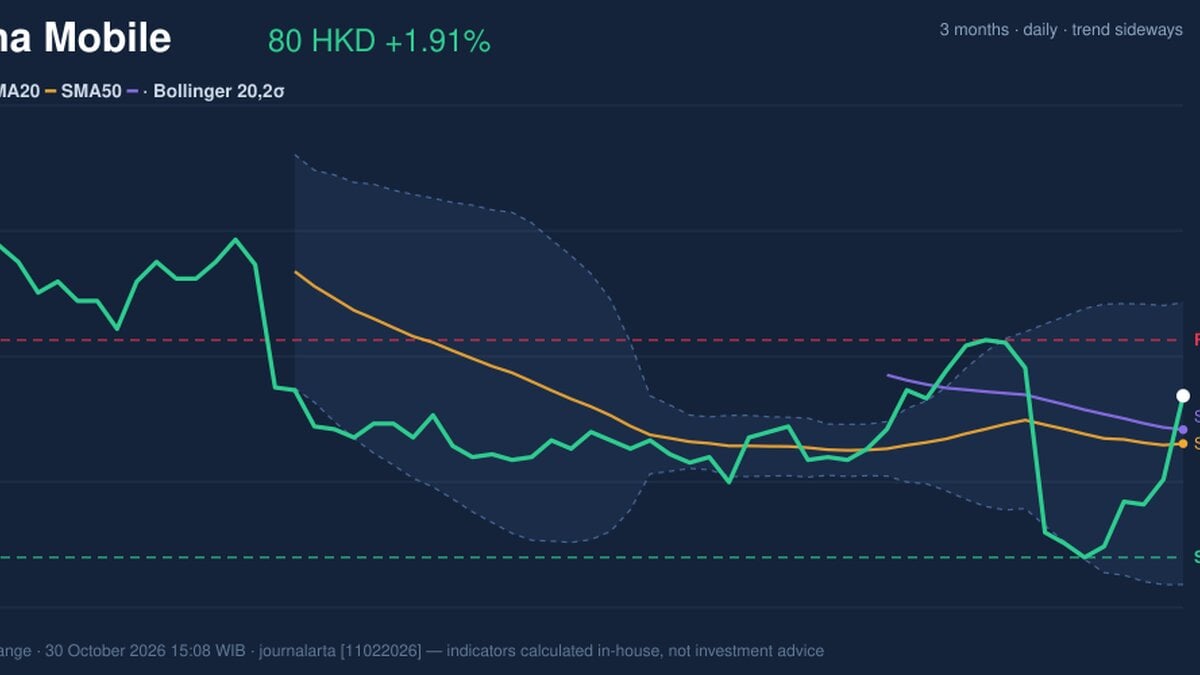
China Mobile ended above its 20-day moving average of HKD 79.14, a short-term positive, but that average remained below the 50-day average of HKD 79.39. The 20-day average fell 0.22% over five days, so the latest price rise has not yet changed the underlying direction of that trend measure. No new moving-average crossover was recorded. The shares were positioned at 74% of their 20-day trading range, between support at HKD 77.10 and resistance at HKD 81.00. That places price closer to the upper boundary, where a sustained break could signal that buyers are overcoming resistance. The three-month high of HKD 84.95 remains a more distant reference point; the three-month low was HKD 77.00. As shown in the chart, the shares are above the 20-day average but still face resistance near the top of the recent range.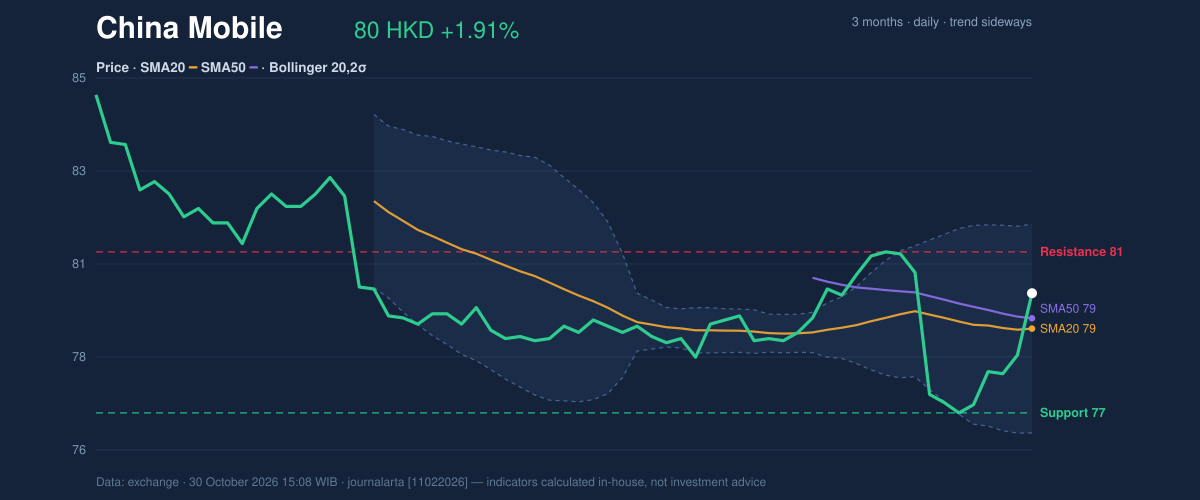
Oscillators & Momentum
Momentum indicators leaned mildly constructive without showing an extreme. The RSI was 56.4, in neutral territory; the Relative Strength Index measures the pace of recent price moves, and this reading does not indicate that the stock is stretched in either direction. Stochastic %K at 64.5 stood above %D at 39.8, also within neutral territory, suggesting improving short-term momentum rather than a decisive breakout signal. The MACD histogram turned positive at 0.008, with MACD at -0.312 just above its -0.320 signal line. The histogram tracks the gap between those lines: its move into positive territory points to a modest improvement in momentum, but both MACD readings remain below zero. That distinction matters: the near-term signal has improved, while the broader momentum measure has not yet confirmed a stronger trend. The chart shows RSI, MACD and Stochastic together, highlighting the positive histogram alongside neutral oscillator readings.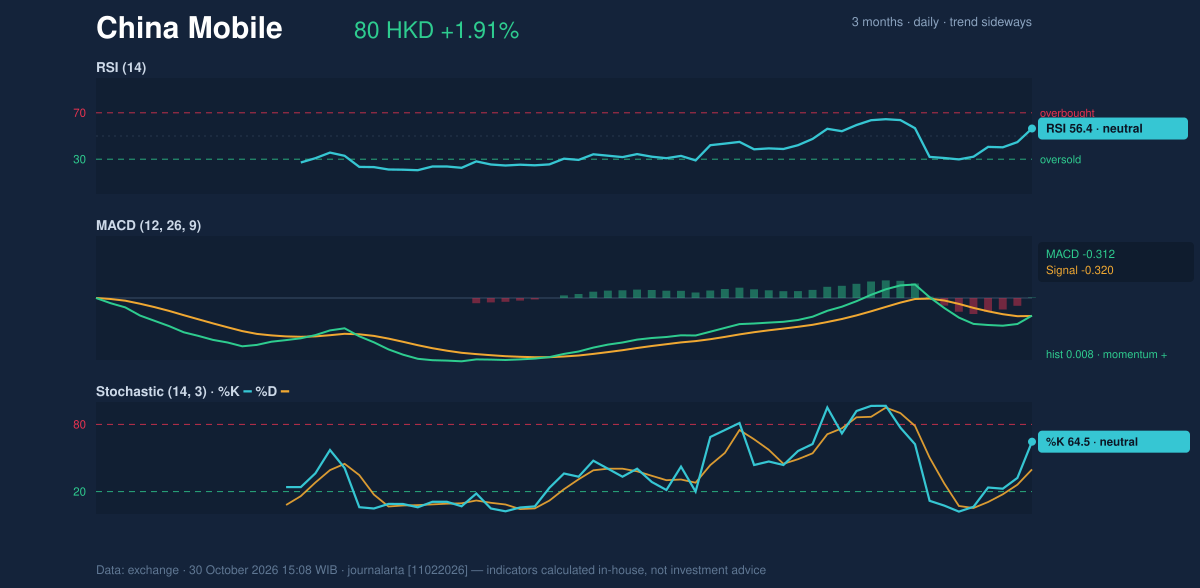
Volatility & Volume
The Bollinger bands were narrowing, a pattern often called a squeeze: it signals that recent price variability has contracted and that a larger move may follow, but not which direction it will take. The band width was 6.4%, with the upper band at HKD 81.67, the middle band at HKD 79.14 and the lower band at HKD 76.61. At 67% of the band range, price was in the upper half, but not yet at the upper boundary. Trading volume reached 23,094,582 shares, about 1.6 times the 20-day average of 14,788,516. That surge gives the day’s move more weight than a rise on quiet trading. Yet OBV, a running measure of whether volume is accumulating on up days or down days, fell. The divergence cautions that the volume increase has not translated into a clear accumulation signal. Average True Range, a measure of typical daily movement, was HKD 1.10, or 1.4% of the share price. That points to relatively low volatility at present; a breakout from the narrowing bands would therefore be a meaningful change in the recent trading pattern.Key Levels & Scenarios
A move above HKD 81.00 would clear the stated 20-day resistance; the upper Bollinger band at HKD 81.67 is the next reference in the supplied data. Failure to hold the 20-day average at HKD 79.14 would weaken the immediate setup, while a decline through HKD 77.10 would break the identified support. The three-month low of HKD 77.00 sits just below that support zone.Technical Verdict: HOLD (wait & see)
The indicators support a cautious, conditional stance rather than a clear directional call. First, price is above the 20-day average and the MACD histogram has turned positive. Second, the shares are near resistance, while the 20-day average is still declining and no new moving-average crossover has formed. Third, volume surged but OBV fell, leaving participation unconfirmed. - Ideal Entry Range: HKD 79.14–80.00, anchored to the 20-day average and latest price. - Exit Target (Target Price): HKD 81.00–81.67, using the stated resistance and upper Bollinger band. - Stop Loss protection: HKD 77.10, at the stated 20-day support. - Invalidation: The HOLD view is invalidated if price falls below HKD 77.10. For non-traders, the signals are improving, but the shares have yet to prove they can break resistance or hold support.Data source: supplied Hong Kong market data for the Friday, October 30, 2026 session.
Why China Mobile is in focus today
- One-day move of 1.91%, about 1.4× its average daily range (ATR)
- Volume at 1.6× the 20-day average
- MACD histogram has just turned positive
Selected automatically from 16 HKEX (Hong Kong) stocks by a technical-signal score with daily weighted randomisation — not a recommendation.
Summary Data China Mobile
| Last price | 80.00 HKD |
| Change 1 day / 5 days / 1 month | 1.91% / 3.76% / 0.69% |
| Trend / MA-cross | sideways / none |
| SMA20 / SMA50 | 79.14 / 79.39 |
| RSI (14) / Stochastic %K | 56.4 / 64.5 |
| Bollinger %B / ATR | 67% / 1.10 |
| Support / Resistance 20 days | 77.10 / 81.00 |
| Data as of | 30 October 2026 15:08 WIB |
Disclaimer: This technical analysis is generated automatically from exchange data and indicators calculated by JournalArta, for information and education only. The verdict and the entry, target and stop-loss levels are not investment advice or a solicitation to buy or sell any security. Investment decisions and their risks rest solely with the reader.
Track China Mobile share price daily: live levels, support/resistance and our full China Mobile analysis history.