DBS Stock Drops 0.91% on Friday, Testing Support Level
On October 30, 2026: price 73.13 SGD, trend downtrend, RSI 33.1, support 73.13, resistance 78.56. technical analysis of dbs stock. DBS Stock Drops — full…
Why DBS is in focus today
- Trading near its 3-month low (72.50)
- Downtrend extending (5-day change -1.76%)
Selected automatically from 16 SGX (Singapore) stocks by a technical-signal score with daily weighted randomisation — not a recommendation.
Trend & Price Action
The short-term structure remains weak. DBS traded below its 20-day moving average of S$74.66, which itself fell 1.29% over five days, and below its 50-day average of S$76.23. No new moving-average crossover was reported. The lack of a fresh crossover does not alter the underlying message: price and the shorter-term average remain beneath the longer-term reference, while the short-term average is declining. The price sat at the bottom of its 20-trading-day range, between support at S$73.13 and resistance at S$78.56. The three-month low of S$72.50 is nearby, but proximity to a low is not, by itself, evidence of a reversal. The session’s close also matches the stated 20-day support level, making the next response around this zone especially relevant. As shown in the chart, price is positioned below both moving averages and near the lower part of the recent range.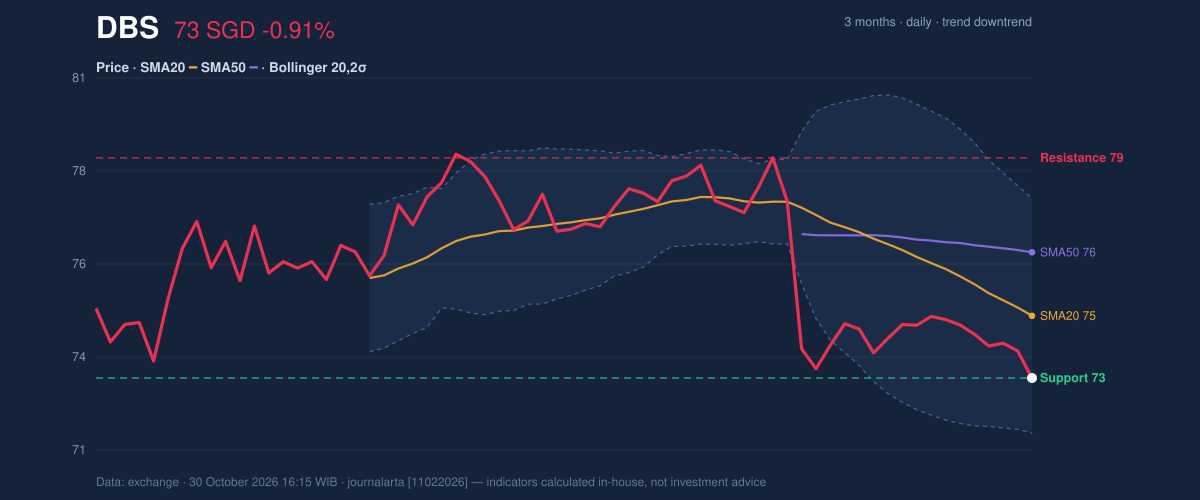
Oscillators & Momentum
The indicators show weakness, but not a uniform signal of an established rebound. The RSI is 33.1, classified as neutral in the supplied data; it is close to the lower end of the scale, but does not independently confirm a turn. The Stochastic is oversold, with %K at 14.5 and %D at 34.1. That can occur when selling has been persistent; an oversold reading is not a timing signal unless price and momentum begin to recover. The MACD remains negative: at -0.766, it is below its -0.708 signal line, and its histogram is -0.058. This points to negative momentum rather than a confirmed bullish divergence. Taken together, the readings suggest the stock may be stretched near support, while the broader momentum picture still leans downward. The chart shows how the low Stochastic reading sits alongside a negative MACD, rather than a clear cross-current pointing to a reversal.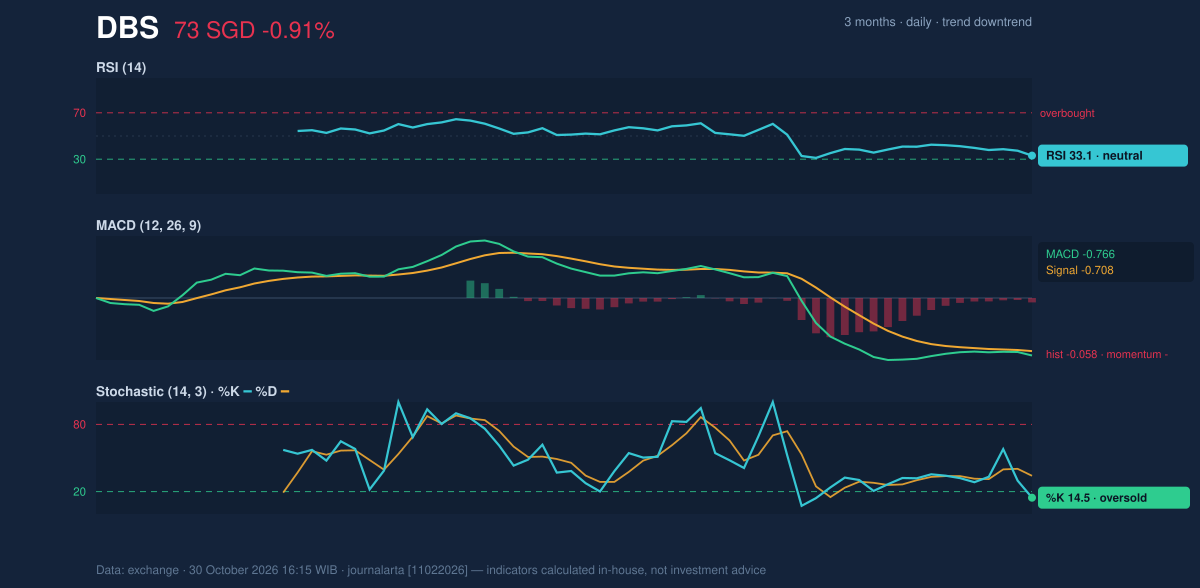
Volatility, Volume & Key Levels
DBS’s Bollinger Band width is 7.7% and is narrowing, a squeeze that signals compressed volatility and the potential for a larger move, but not its direction. The %B reading of 23% places price in the lower part of the bands: the lower band is S$71.77 and the middle band, which coincides with the 20-day average, is S$74.66. ATR is S$0.88, or 1.2% of the share price, indicating comparatively low recent daily volatility. The combination matters: price is pressed toward the lower band, but volatility is subdued. Meanwhile, above-average volume and falling OBV suggest that heavier activity has accompanied net selling rather than accumulation. A hold above S$73.13, followed by a move back through S$74.66, would offer more evidence that pressure is easing. A failure at support would put the three-month low of S$72.50 in focus; a sustained recovery would face resistance at S$78.56.Technical Verdict: HOLD (wait & see)
The technical balance favors caution rather than a directional call. The declining 20-day average and price below both moving averages confirm a downtrend; negative MACD and falling OBV show that momentum and trading participation have not yet turned. Oversold Stochastic readings and the nearby three-month low leave room for stabilization, but do not confirm it. - Entry range: S$72.50–S$74.66, bounded by the three-month low and the 20-day average; this is a technical reference range, not an instruction. - Exit target: S$78.56, the stated 20-day resistance. - Stop-loss reference: Below S$71.77, the lower Bollinger Band. - Invalidation: The HOLD assessment is invalidated if price breaks below S$71.77, indicating a move beyond the supplied lower-band reference. In plain English, DBS is near a recent low, but the indicators have not yet shown that selling has ended.| Metric | Reading |
|---|---|
| Last price | S$73.13 |
| Daily / five-day / one-month change | -0.91% / -1.76% / -5.28% |
| SMA20 / SMA50 | S$74.66 / S$76.23 |
| Three-month high / low | S$79.05 / S$72.50 |
| Bollinger bands: upper / middle / lower | S$77.56 / S$74.66 / S$71.77 |
| RSI / Stochastic %K, %D / MACD | 33.1 / 14.5, 34.1 / -0.766 |
Summary Data DBS
| Last price | 73.13 SGD |
| Change 1 day / 5 days / 1 month | -0.91% / -1.76% / -5.28% |
| Trend / MA-cross | downtrend / none |
| SMA20 / SMA50 | 74.66 / 76.23 |
| RSI (14) / Stochastic %K | 33.1 / 14.5 |
| Bollinger %B / ATR | 23% / 0.88 |
| Support / Resistance 20 days | 73.13 / 78.56 |
| Data as of | 30 October 2026 16:15 WIB |
Disclaimer: This technical analysis is generated automatically from exchange data and indicators calculated by JournalArta, for information and education only. The verdict and the entry, target and stop-loss levels are not investment advice or a solicitation to buy or sell any security. Investment decisions and their risks rest solely with the reader.
Track DBS share price daily: live levels, support/resistance and our full DBS analysis history.