NKE Stock Technicals Today: Gains 2.48%, Momentum Weakens
On Agustus 19, 2026: price 40.06 USD, trend downtrend, RSI 41.7, support 39.09, resistance 43.22. technical analysis of nke stock. NKE Stock Technicals — full…

Nike shares traded at 40.06 USD on the NYSE, up from a 39.09 previous close, but the move sits inside a broader slide: the stock is still down 3.05% over 5 days and 6.75% over 1 month, according to Yahoo Finance data cited in the market feed. What matters here is not the one-day bounce itself, but that buyers are trying to stabilize price while the chart remains below its short-term trend line and the longer moving average. In plain terms, the stock is trying to catch its breath, but the burden of proof is still on the bulls.
Trend & Price Action
The trend structure is still weak. Nike is in a downtrend, with the SMA20 sloping down -1.87% over 5 days, which means the recent average price is falling rather than flattening out. Price is also trading below the SMA20 at 41.63 and well under the SMA50 at 42.69. That positioning matters because moving averages often act like a market’s memory: when price stays below them, rallies tend to be treated as rebounds unless buyers can reclaim those lines and hold above them.
The chart also shows no fresh MA-cross, so there is no new signal that the short-term trend has overtaken the medium-term one. In other words, the market has not yet produced the kind of crossover that would suggest a durable change in direction.
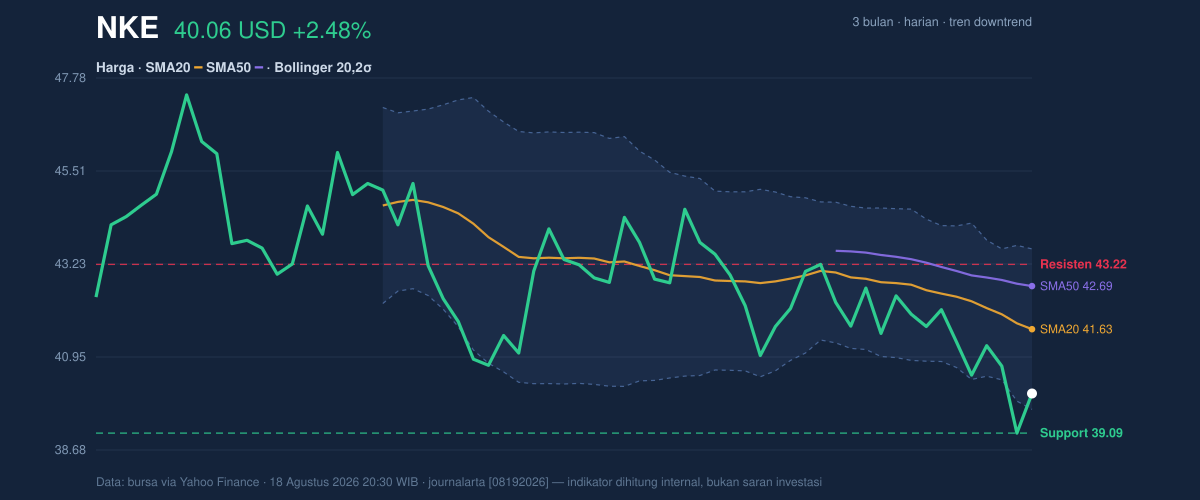
The stock is sitting near the lower half of its recent range, with the latest price at only 23% of the 20-day support-resistance band from 39.09 to 43.22. That location is important: it tells readers the rebound has not yet reclaimed the zone where sellers previously regained control. The 3-month range reinforces that tension — the stock is above the 3-month low of 38.86, but still far from the 3-month high of 47.65.
A bounce is not the same as a reversal.
It still has work to do.
Oscillators & Momentum
Momentum is mixed, and that is the clearest reason this chart remains in the “wait and see” camp. The RSI at 41.7 is neutral, which means the stock is neither washed out nor overextended. For general readers, RSI is a speed gauge for price moves: readings near 30 can suggest oversold conditions, while readings near 70 can indicate stretched upside. Nike is in neither extreme, so the latest move does not yet carry the force of a full momentum turn.
The Stochastic %K at 27.6 and %D at 13.7 also sit in neutral territory, but with %K above %D, the short-term line is trying to improve. That can hint at a near-term base, yet it is not enough on its own to confirm a trend change. The more decisive signal comes from the MACD at -0.723, below its signal line at -0.506, with a histogram of -0.217. MACD measures whether momentum is strengthening or fading; when it stays below the signal line and the histogram is negative, downside pressure is still present even if price has staged a small rebound.
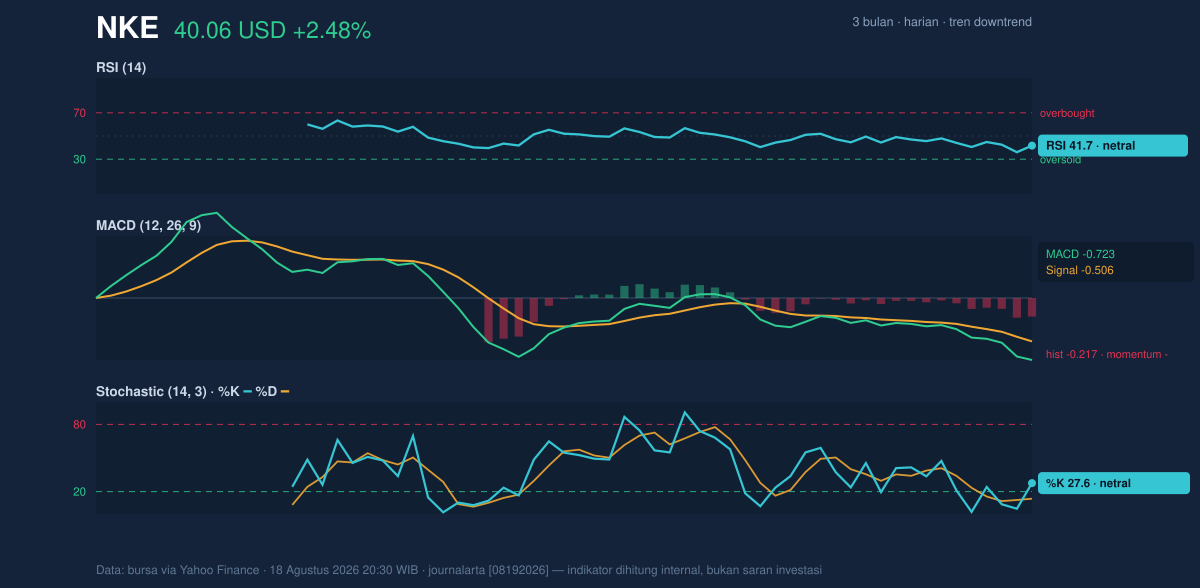
So the oscillator picture is not bearish in an extreme sense, but it is still too soft to call the recent lift a confirmed recovery.
Volatility & Volume
Volatility is present, but not disorderly. The ATR(14) at 1.21, equal to 3.0% of price, signals moderate day-to-day movement. ATR is a measure of how far a stock tends to travel in a session; here, it suggests Nike can move enough to test nearby levels without implying a panic-style break.
The Bollinger Bands add another useful clue. Price sits near the lower band at 39.67, with %B at 10%, which means the stock is trading very close to the bottom of its recent volatility envelope. That often reflects pressure, but the band width of 9.4% is still normal rather than compressed, so this is not a classic “squeeze” waiting for a violent breakout. Instead, the chart says the stock has room to swing, and the current position near the lower band shows sellers still have the edge unless price can climb back toward the middle band at 41.63.
Volume complicates the picture in a constructive but not definitive way. Last volume came in at 39,095,200, about 1.6× the 20-day average of 24,548,110. That is real participation, not a quiet drift. But the OBV is down, which means the broader balance of volume has not yet turned supportive. In practical terms, more shares changed hands, but the longer-running accumulation trend still looks weak.
Volume is active.
Accumulation is not yet.
Key Levels & Scenarios
The immediate map is clear. Support at 39.09 is the first line to watch, with the lower Bollinger band at 39.67 reinforcing that area. If price loses that zone, the chart opens toward the 3-month low of 38.86. On the upside, resistance at 43.22 is the first hurdle, followed by the SMA50 at 42.69 and the upper Bollinger band at 43.60. Those are not just numbers; they are the places where traders who bought lower may choose to sell, and where a rally needs to prove it can absorb supply.
The most important signal is whether Nike can reclaim the middle of its volatility range. A move back above 41.63 would show the stock is no longer hugging the lower band and could begin to repair the short-term structure. Until then, every rally is still being judged against a falling average.
Technical Verdict: HOLD (wait & see)
HOLD (wait & see)
- RSI at 41.7 is neutral, so momentum is not stretched enough to justify a strong directional call.
- MACD is negative and still below its signal line, which says downside pressure has not fully cleared.
- Price remains below the SMA20 at 41.63 and SMA50 at 42.69, so the trend has not turned.
Verdict invalidated if price breaks below 39.09, because that would expose the 38.86 3-month low and confirm renewed weakness.
- Ideal Entry Range: 39.09 to 39.67
- Exit Target (Target Price): 41.63 to 43.22
- Stop Loss protection: below 38.86
For non-traders: the chart says Nike is trying to stabilize, but it has not yet shown enough strength to prove the slide is over.
“What matters now is whether buyers can defend 39.09 — if they can’t, the market will say this rebound was only a pause.”
Summary Data NKE
| Last price | 40.06 USD |
| Change 1 day / 5 days / 1 month | 2.48% / -3.05% / -6.75% |
| Trend / MA-cross | downtrend / none |
| SMA20 / SMA50 | 41.63 / 42.69 |
| RSI (14) / Stochastic %K | 41.7 / 27.6 |
| Bollinger %B / ATR | 10% / 1.21 |
| Support / Resistance 20 days | 39.09 / 43.22 |
| Data as of | 18 Agustus 2026 20:30 WIB |

