Momentum Gains, CRM Stock Gains 2.71% Today
On Agustus 19, 2026: price 196.14 USD, trend uptrend, RSI 59.2, support 156.93, resistance 201.37. technical analysis of crm stock. Momentum Gains — full…

Salesforce Inc. rose to 196.14 USD on the NYSE in late trading data from Yahoo Finance on 18 August 2026, extending a broader uptrend even as the stock remained just below a near-term ceiling at 201.37. The move matters because CRM is trading above both its SMA20 at 185.71 and SMA50 at 172.76, which tells investors the stock is not merely bouncing day to day; it is still positioned in a constructive intermediate trend. But the tape is not one-sided. The latest volume was only 1.1× normal and OBV is falling, a sign that price has been advancing with less underlying participation than the chart alone might suggest.
Trend & Price Action
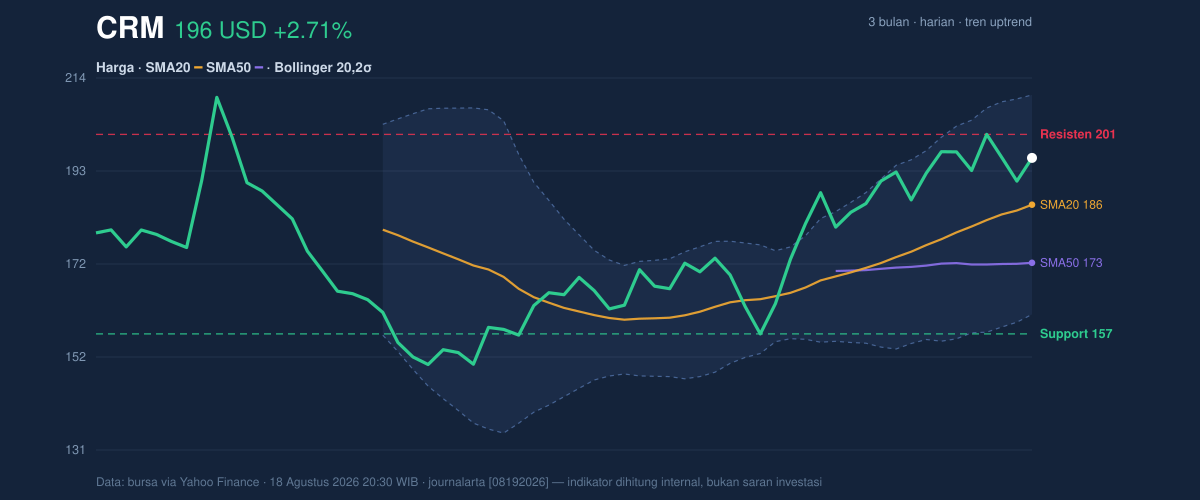
The chart shows CRM holding above its short- and medium-term trend lines, with the price above SMA20 and a wider gap above the SMA50. That spacing is important: when a stock sits above both moving averages, it usually means buyers have kept control across multiple time frames, not just for one session. The SMA20 slope of 3.45% over 5 days reinforces that the short-term trend is still rising rather than flattening out.
At the same time, Salesforce is not far from the upper end of its recent trading band. The stock sits at about 88% of the 20-hour range, which means it is trading near the top of the zone defined by 156.93 support and 201.37 resistance. That positioning is bullish, but it also leaves less room for a relaxed move higher without first clearing resistance. The broader three-month range, from 146.32 to 211.34, shows the shares are still below the recent high, so the market has not yet fully reclaimed the upper part of that range.
Oscillators & Momentum
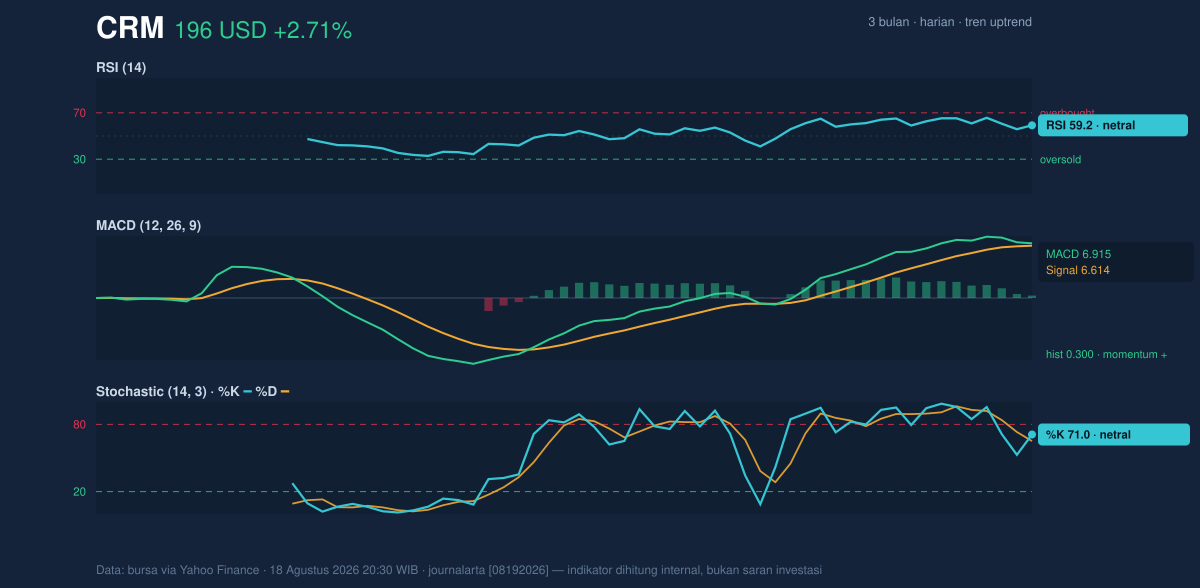
Momentum is positive, but not stretched. The RSI at 59.2 is neutral, which usually means the stock is neither overbought nor oversold. In plain language, the rally has room to continue, but it is not flashing the kind of overheated signal that often appears when momentum becomes too one-sided. The Stochastic %K at 71.0 and %D at 65.1 also sit in neutral territory, though they are leaning toward the upper half of the scale. That suggests the stock has upside momentum, but it is moving closer to a zone where traders begin watching for fatigue.
The cleaner message comes from MACD. Salesforce’s MACD at 6.915 is above its signal line at 6.614, with a positive histogram of 0.300. That combination usually indicates that upward momentum is still intact and improving, even if the move is not accelerating sharply. In other words, the trend is supported by momentum, but the indicators are not screaming breakout yet. They are confirming strength, not euphoric excess.
Volatility & Volume
The volatility picture is the most revealing part of the setup. The Bollinger Band width at 26.3% shows the bands are widening, which typically means the market expects larger price swings. Combined with an ATR of 8.10, or 4.1% of price, the message is that CRM can move quickly in either direction from here. Wider bands often appear when a stock exits a quieter phase and starts to establish a new directional move. Here, that move has been upward, but the stock is now approaching the top band at 210.16, a level that may act as a pressure point if momentum stalls.
The %B reading of 71% says the price is trading in the upper part of the Bollinger envelope, which is consistent with strength but also means it is closer to the upper boundary than the lower one. That matters because stocks often pause or consolidate when they spend time near the top of the band after a strong run.
Volume, however, is the caution flag. The latest print of 14,144,100 shares is only modestly above the 20-hour average of 12,642,095, and the OBV is down. OBV, or on-balance volume, is a way of tracking whether volume is confirming price direction. When OBV falls while price rises, it can mean the rally is not being fully confirmed by accumulation. That does not reverse the trend on its own, but it does suggest the move may be more fragile than the price chart alone implies.
Key Levels & Scenarios
The near-term map is fairly clear. 201.37 is the first resistance that matters, because it sits just above the current price and aligns with the upper edge of the recent range. Above that, the 210.16 Bollinger upper band and the 211.34 three-month high form the next visible ceiling. On the downside, 185.71 is the first support to watch because it matches the SMA20 and the Bollinger midline. A break below that level would tell the market that the short-term trend is losing traction. Below that, 172.76 becomes the more important medium-term support because it marks the SMA50 and would signal a deeper reset in trend structure.
If CRM clears 201.37 with stronger participation, the chart would shift from a range-bound advance toward a more decisive breakout attempt. If it fails there and slips back toward 185.71, the stock would likely be viewed as consolidating within its broader uptrend rather than extending it immediately.
Technical Verdict: HOLD (wait & see)
Salesforce’s chart is constructive, but not fully confirmed by participation, so the technical read is HOLD (wait & see).
- Reason 1: Trend is intact — price is above SMA20 and SMA50, and the SMA20 slope is rising.
- Reason 2: Momentum is supportive — MACD is above signal and the histogram is positive, while RSI 59.2 remains neutral.
- Reason 3: Caution from participation — OBV is down even as price holds near the top of its range, which weakens confirmation.
- Verdict invalidated if price falls below 172.76, because that would undercut the medium-term moving-average support.
- Ideal Entry Range: 185.71 to 196.14
- Exit Target: 201.37 to 210.16
- Stop Loss protection: below 172.76
For non-traders, that means Salesforce still looks healthy on the chart, but it needs stronger proof from volume before the next leg higher can be considered established.
The latest three-month high for CRM is 211.34.
Summary Data CRM
| Last price | 196.14 USD |
| Change 1 day / 5 days / 1 month | 2.71% / -0.67% / 15.34% |
| Trend / MA-cross | uptrend / none |
| SMA20 / SMA50 | 185.71 / 172.76 |
| RSI (14) / Stochastic %K | 59.2 / 71.0 |
| Bollinger %B / ATR | 71% / 8.10 |
| Support / Resistance 20 days | 156.93 / 201.37 |
| Data as of | 18 Agustus 2026 20:30 WIB |
Track CRM stock price daily: live levels, support/resistance and our full CRM analysis history.


