CRM Momentum Weakens: Stock Gains 4.73% (September 15, 2026)
On September 15, 2026: price 259.43 USD, trend uptrend, RSI 69.8, support 190.97, resistance 264.43. technical analysis of crm stock. CRM Momentum Weakens —…

Salesforce (NYSE: CRM) rose to 259.43 USD on 14 September 2026, up 4.73% from the previous close of 247.72, and the move left the software group near the top of its recent trading range. A short burst of strength. But the chart, as shown in the price action view, also says the stock is now testing where rallies often start to slow.
Trend & Price Action
The main message from the trend tools is still constructive: CRM remains in an uptrend, with the price above the SMA20 at 233.79 and the SMA50 at 200.47 sitting well below both. That gap matters because it shows the stock is trading above both its short- and medium-term average cost bases, a sign that recent buyers have been willing to pay up rather than wait for pullbacks.
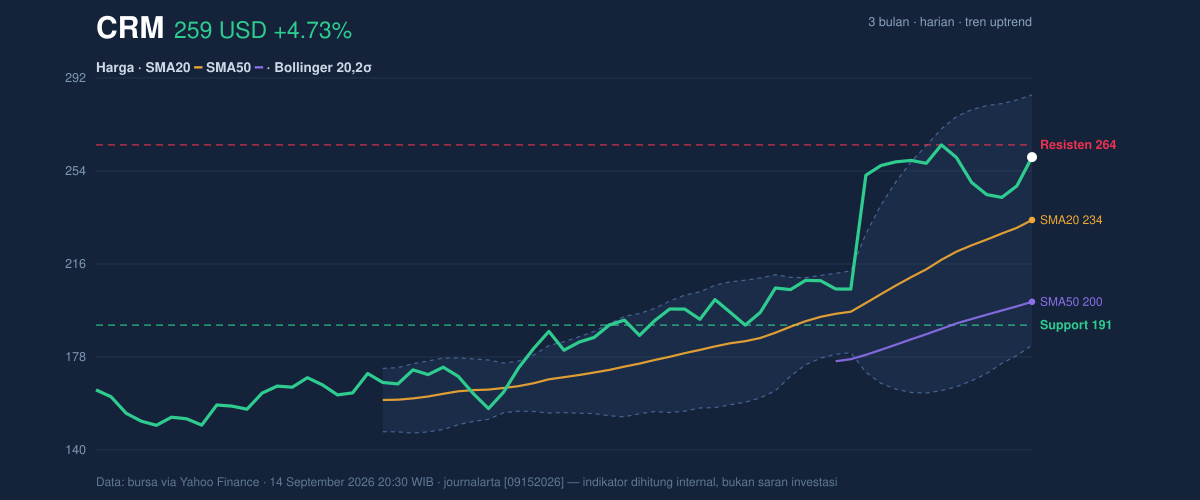
The broader structure is less about whether the trend exists and more about how extended it has become. The stock is now at 93% of its 20-hour range, with support at 190.97 and resistance at 264.43. That positioning near the upper edge means the market is no longer in “cheap rebound” territory; it is in the zone where traders begin to question whether momentum can keep carrying price higher without a pause.
The 3-month high of 268.27 is close enough to matter. It acts as the next visible ceiling, and the fact that CRM is already only a few dollars below the 20-hour resistance suggests the market is approaching a decision point rather than moving in open air. The SMA20 slope of 5.83% over 5 days reinforces the bullish structure, but the lack of a new MA-cross means the strongest part of the trend may already be underway rather than just beginning.
Oscillators & Momentum
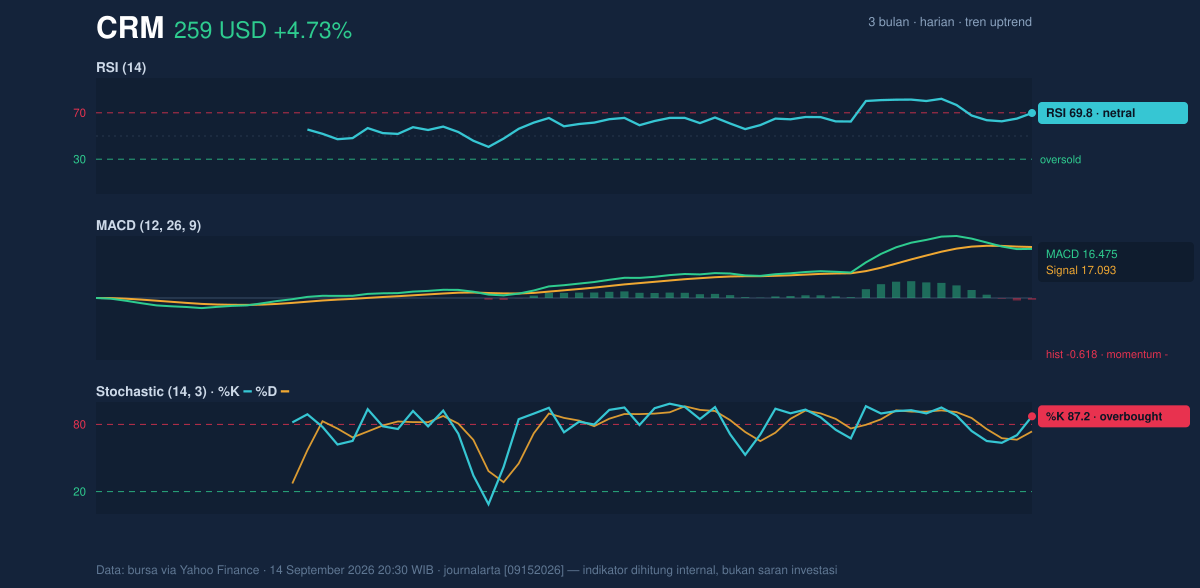
The momentum picture is more mixed than the price chart alone would suggest. The RSI at 69.8 is described as neutral in the data, but it sits close to the classic overbought threshold, which tells readers the stock has already absorbed a lot of buying pressure. In plain language, the market is strong, but it is also crowded near the top end of its recent appetite.
The Stochastic %K at 87.2 and %D at 73.7 are more explicit: this is overbought. That does not automatically mean a reversal is coming, but it does mean the stock is trading in a zone where late buyers are paying higher prices for diminishing short-term upside. When stochastic readings are this elevated, the risk is not only a drop, but also a period of sideways digestion if fresh demand fails to expand.
The MACD at 16.475 remains above zero, which keeps the broader trend intact, but it is below the signal line at 17.093, with a histogram of -0.618. That negative histogram is the clearest momentum warning in the set: the trend is still positive, yet the pace of acceleration has weakened. In technical terms, price is still elevated, but the engine is not revving as hard as before.
Volatility & Volume
The Bollinger Band structure shows why the stock may feel stretched. The bands are wide, with upper band at 284.80, middle at 233.79, and lower at 182.79, while the 43.6% band width signals high volatility. Wide bands usually mean the market has already made a meaningful move and is allowing larger swings in both directions. The %B at 75% places CRM above the midpoint and closer to the upper band, which supports strength but also indicates limited room before the price enters the most overheated part of the envelope.
The ATR(14) at 12.41, equal to 4.8% of price, confirms that daily movement can be sharp. That matters because a stock with this much volatility can overshoot support or resistance quickly once momentum shifts. Volume adds a subtle caution: the latest print of 12,963,700 was only 0.8× normal versus the 20-hour average of 16,701,335. So while price rose strongly, participation was not especially heavy. The OBV is rising, which suggests accumulation is still present over time, but the latest session did not come with the kind of volume surge that usually confirms a decisive breakout.
Key Levels & Scenarios
The immediate technical battle is between 264.43 resistance and the 259.43 last price. If CRM clears resistance and holds above it, the chart opens a path toward the 3-month high of 268.27, and then the upper Bollinger band at 284.80 becomes the next reference point. If the stock fails to push through 264.43, the most likely outcome is a cooling phase back toward the SMA20 at 233.79, which is also the Bollinger middle band and therefore a natural magnet for price if momentum fades.
The deeper floor remains support at 190.97, but that level is far below current trading and would only come into play if the trend suffered a major breakdown. The more practical warning sign is whether the stock can stay above the recent breakout area without losing momentum, because the technical picture is strongest when price is rising with volume, not merely drifting upward inside a volatile band.
Technical Verdict: HOLD (wait & see)
HOLD (wait & see)
- MACD histogram is negative, showing momentum is weaker even though the broader trend remains up.
- Stochastic is overbought, which often precedes consolidation or a pullback after a strong run.
- Price is near resistance at 264.43 and close to the 3-month high of 268.27, so upside needs confirmation rather than assumption.
Verdict invalidated if price falls below 233.79.
- Ideal entry range: 233.79 to 239.00
- Exit target: 264.43, then 268.27
- Stop loss protection: below 233.79
For non-traders, this means the stock is still strong, but it is already close to a level where the market may need to pause before moving further.
Salesforce’s latest close was 259.43 USD.
Summary Data CRM
| Last price | 259.43 USD |
| Change 1 day / 5 days / 1 month | 4.73% / 0.08% / 32.22% |
| Trend / MA-cross | uptrend / none |
| SMA20 / SMA50 | 233.79 / 200.47 |
| RSI (14) / Stochastic %K | 69.8 / 87.2 |
| Bollinger %B / ATR | 75% / 12.41 |
| Support / Resistance 20 days | 190.97 / 264.43 |
| Data as of | 14 September 2026 20:30 WIB |


